


In a strange way this is a kind of tribute to the work done by Darryl on his fabulous site, and one of his great innovations in the addition of the ‘rolling’ Fenwick and PDO averages.
A moving average is normally conceptually associated with technical analysis and stock prices. Moving Average is defined as per the image shown below via a simple google search.

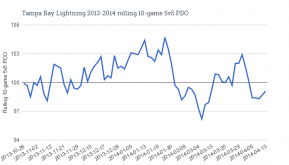
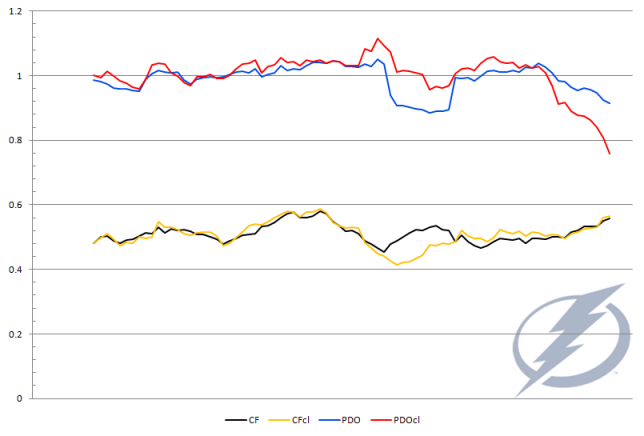
Here’s an example from the 2013-14 Tampa Bay Lightning outlining their rolling 10-game PDO.
Instead of focusing on the game-by-game Corsi or Fenwick, I like the idea of using a moving average to illustrate team trends over a predefined period of time, consistently applied throughout the season. The two elements I decided to focus on each have two components a 5v5 overall and 5v5 in games close (defined below).
Corsi is a shot-based plus/minus representation differential focusing on the accumulation of shot attempts for (shots, missed shots, blocked shots) directed at the opponents net, to the same criteria applied directed on your own goal. Usually represented as a ratio per 20 or 60 minutes, when taking the events that make up Corsi For and dividing the amount of events of Corsi Against, a definitive ratio emerges that can be used to gauge game performance at the player and team level. This is the Corsi Percentage (CF%)
PDO is a metric that based on the simple addition of situational on-ice shooting percentage and on-ice save percentage. Cam Charron wrote a great piece (http://blogs.thescore.com/nhl/2013/01/21/pdo-explained/) explaining the importance and usage of PDO in analysis and I urge you to read over that write up for a greater perspective of the usage in determining ‘puck luck’. PDO has a fulcrum of around 1, or 100, or 1000 depending on the math used to calculated the metric. By fulcrum, I mean that a high PDO will normalize around 1, and a low PDO will do the same. Sustainability of a high/low PDO is very sketchy and the return to the fulcrum is a sensible general rule.
More recently, Tyler Dellow wrote up the correlation between PDO and it’s associated with luck. Sometimes I feel the statistical definition and usage of luck is misinterpreted with the common-view definition, and bounces, but Dellow puts it into perspective here from a position of repeatability.
PDO will provide a basis of on-ice conditions to add context of the underlying Corsi percentages and performance effects.
SCORE EFFECTS
A facet that’s neatly expressed in the charts below is that of score effects. The concept entails the rise of shots against a team faces after building up a lead. Trailing teams will likely build up momentum in order to attempt to get back in the game, create a game-tying goal or cut down a lead, or in the case of a blowout, show some fight in not giving up despite the insurmountable lead.
To differentiate, metrics have been developed to counter score effects. Fenwick and Corsi Close (I’ve applied it here to PDO as well) have been invented. ‘Games Close’ means taking game events during situations where the game is within a goal in the first two periods and tied in the third. Focusing on the ‘close’ data, neutralizes score effects to filter a more pure recollection of a team’s/player’s performance.
It’s interesting to see how the effects are propped up when charting both a 5v5 Corsi percentage against the Corsi Close percentages. Teams dominating in ‘close’ situations then start to run away with the game, have an effect on the 5v5 Corsi in the form of a deflated percentage in relation to the 5v5 close. In other words, a high 5v5 close Corsi is usually followed by a deflated 5v5 Corsi as score effects come into play. The opposite also holds true and a team struggling at 5v5 close may find themselves trailing to the point that they step up the play to inflate their overall 5v5 Corsi in relation to the close percentages.
When viewing these charts pay some attention to the disparity in the close and overall moving averages to gauge if teams were truly running away with games, or if they were playing tight games and winning. Consequences of PDO can also help determine ‘puck luck’ interjection and contribution of on-ice conditions.
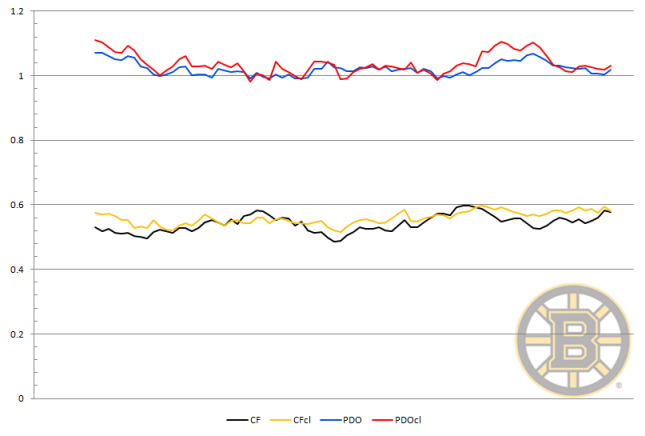
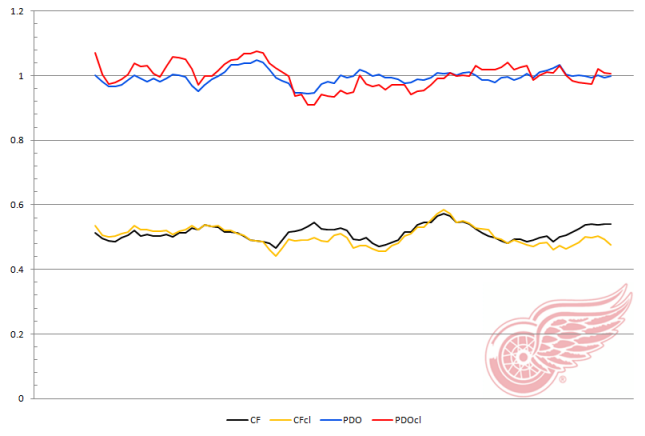
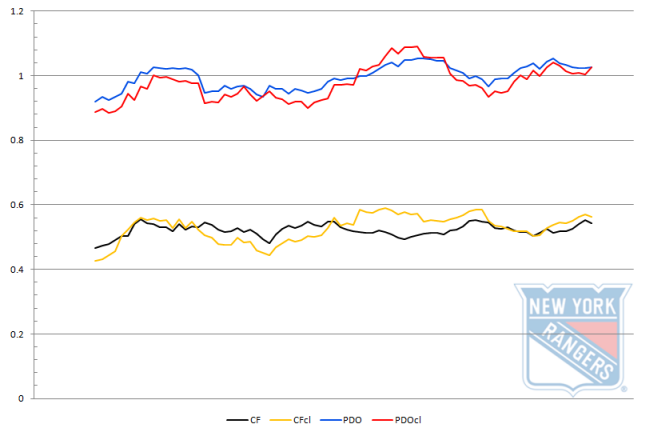
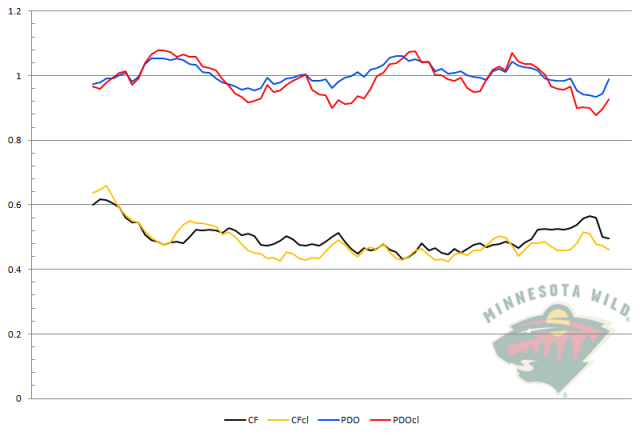
Presented below is the First Round of the Stanley Cup Playoffs pairings teams season long rolling 10 game moving average of teams Corsi % and Corsi Close % as well as the PDO and PDO Close.
All the charts below tracked at 5v5 even strength and 5v5 Games Close.
EASTERN CONFERENCE
Boston Bruins Vs Detroit Red Wings
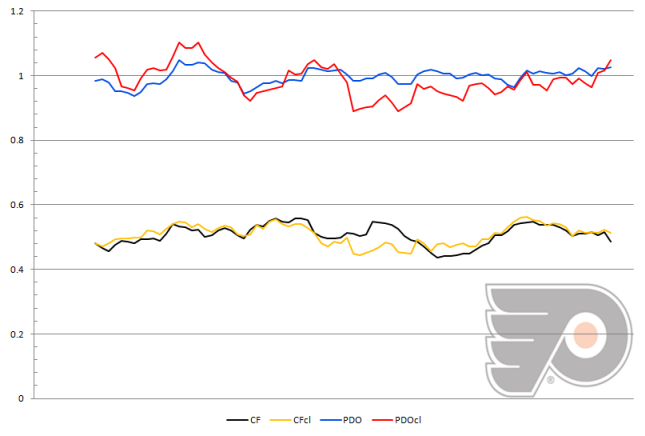
NY Rangers vs Philadelpia Flyers
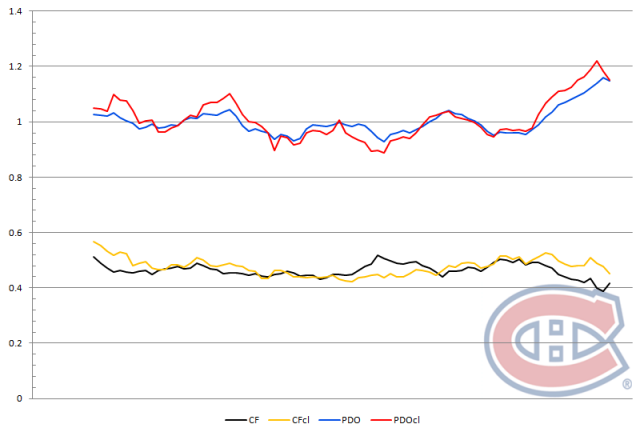
Montreal Canadiens Vs Tampa Bay Lightning
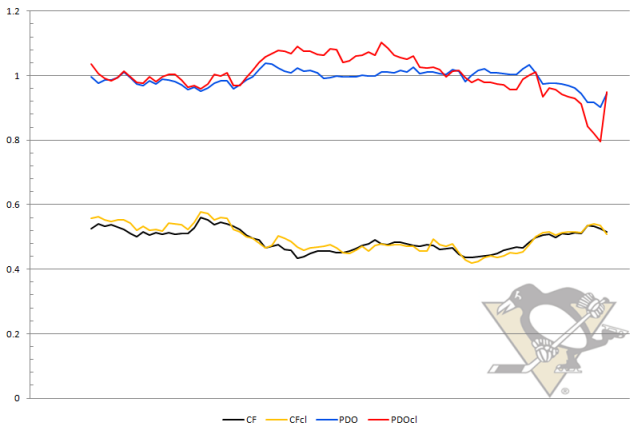
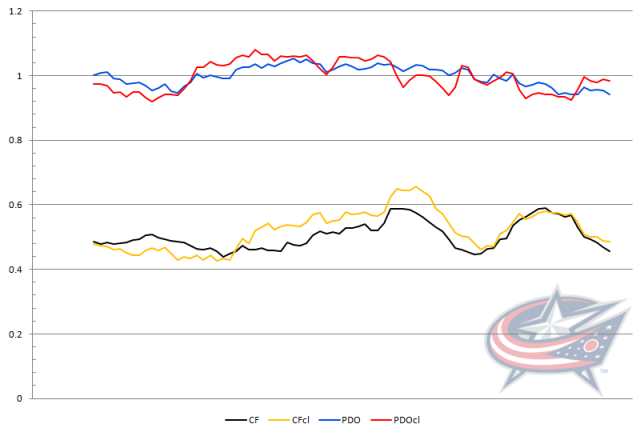
Pittsburgh Penguins Vs Columbus Blue Jackets
WESTERN CONFERENCE
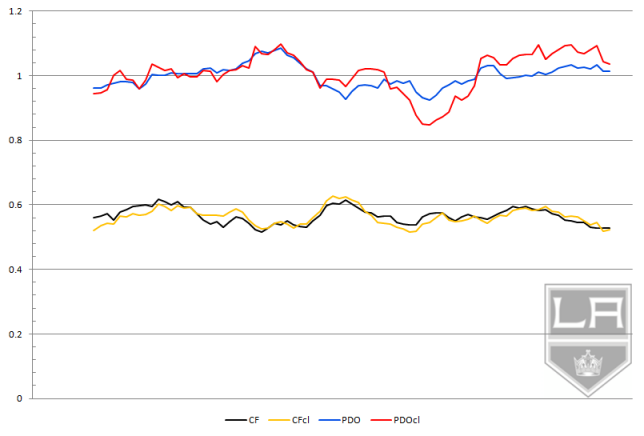
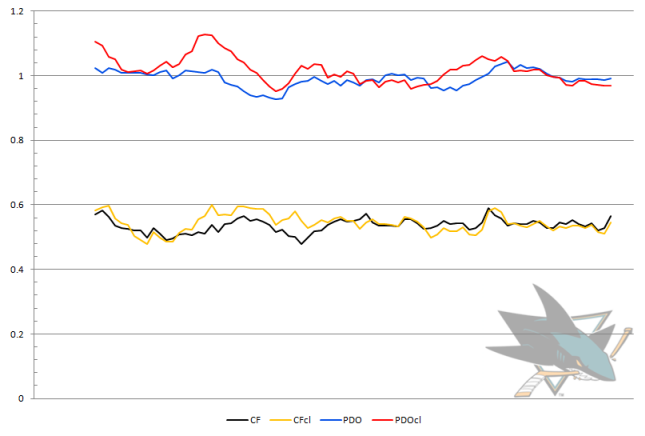
Los Angeles Kings Vs San Jose Sharks
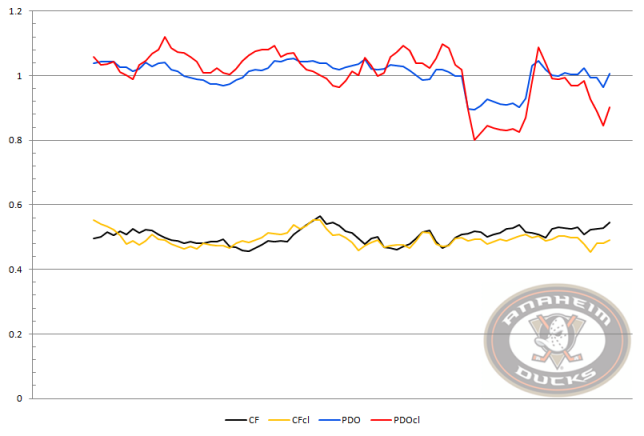
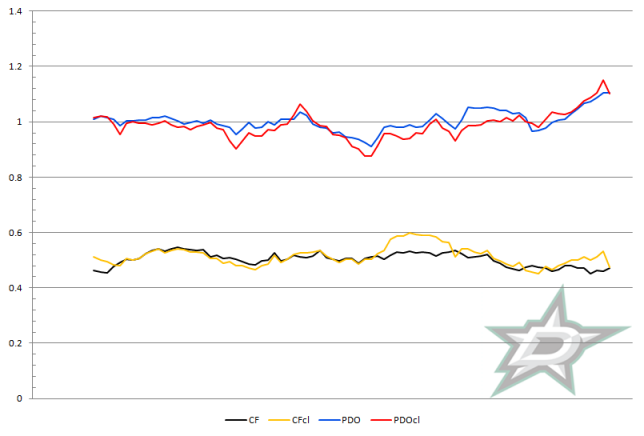
Anaheim Ducks Vs Dallas Stars
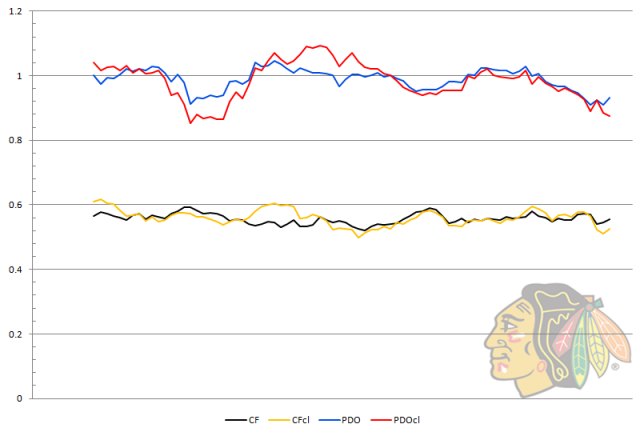
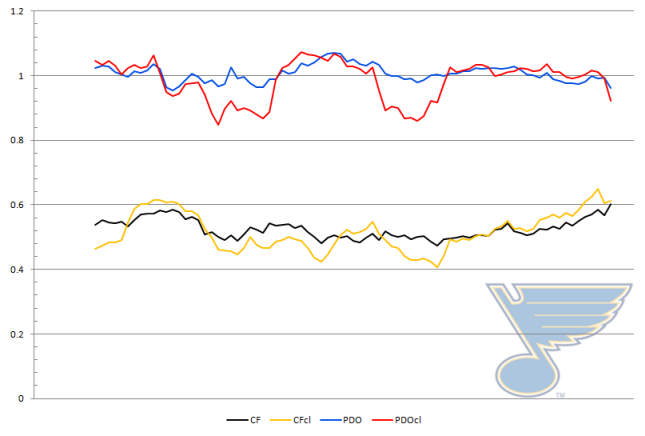
Chicago Blackhawks Vs St. Louis Blues
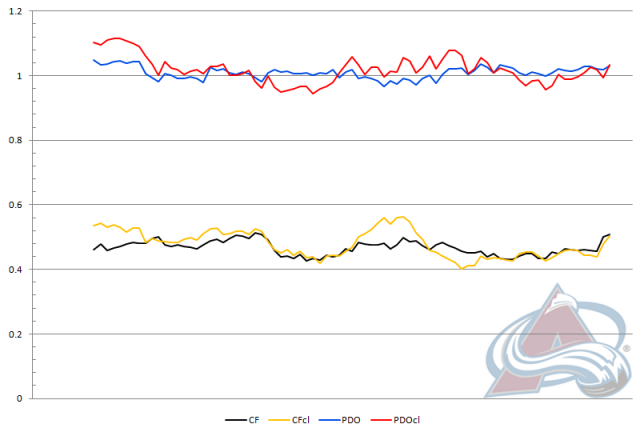
Colorado Avalanche Vs Minnesota Wild
Data compiled via timeonice.com
**********
Follow the McKeen's team on Twitter: