


I’ve been playing around with the percentage of shots making up team and player level Corsi For and Against. In other words, the percentage do shots represented in raw unblocked shot attempts.
I glossed over this towards the end of the 2014-15 season, using static data, but the availability of expanded data via www.war-on-ice.com peaked my curiosity to see what a rolling moving average chart based on shot-share percentage would look like.
As an example here, I am using the Montreal Canadiens, who have had a fairly difficult 2015-16 season to say the least.
In these examples, I’ve used data from the beginning of 2014-15 season up to current. The charts depicts the shot share percentages making up Corsi For and Corsi Against, in 10-game moving averages for score-adjusted 5v5, 5v5 Close and 5v5 Tied game situations.
The bar charts represent the shot on goal share, which is scaled on the right side, with Missed and Blocked shots represented by the coloured lines, scaled to the left.
This is a good starting point for other in-season focus to specific events in which to apply further analysis. I’m a big believer in the micro-analysis involved in the use of data in concentrated periods of time over the season, going to video to determine items not easily identifiable through the data.
For now, I’m only going to illustrate this at the team level, but this can easily be adopted for players as on ice components.
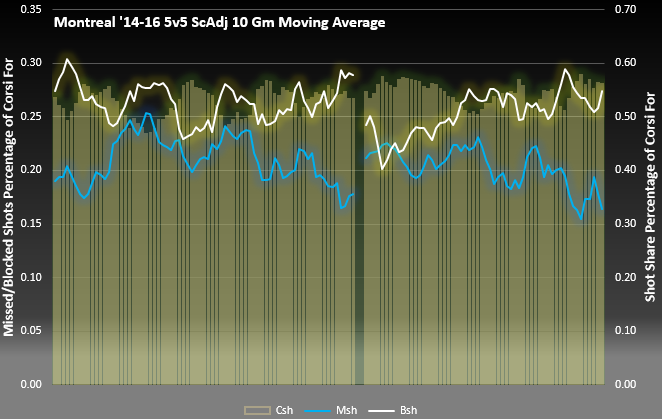
The first chart shows the Montreal Canadiens rolling 10-game average at score adjusted.5v5. The gap is the divide between the past two seasons.
The Habs shot share was well over 50% with the dip being replaced with upticks in missed and blocked shots, coinciding with the Habs season downturn. Missed shot share is trending down as more shots are getting on net recently.
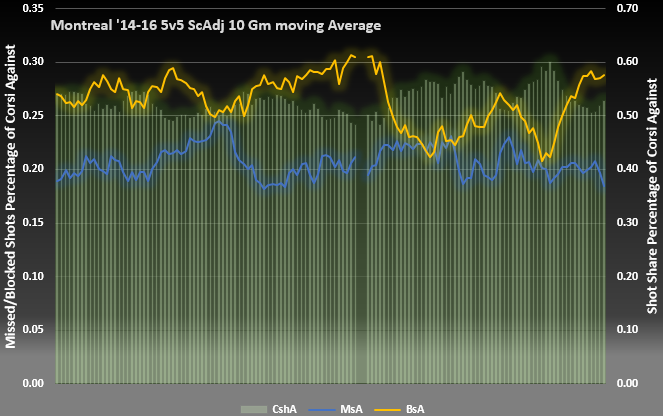
Moving on to the Corsi against (unblocked shot attempts) against the Canadiens. In 2014-15 they seemed to hover around 50% as a shot share, while blocking a higher percentage of shots.
Montreal floundering in 2015-16 due to more than just Carey Price injury has validity. Montreal is allowing more shots on goal as part of their Corsi against makeup and it gets worse as we drill down later. More recently, they were able to curb the shots on goal, seemingly blocking a higher percentage of shots.
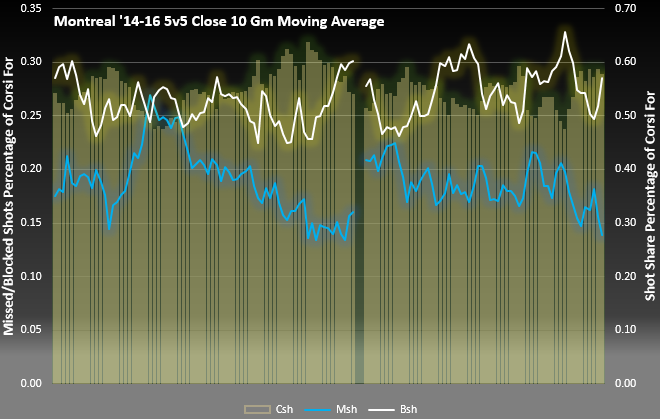
In games close (within one goal in the first period and tied in the third), the chart exaggerates the blocked shot rate, while the shot share dips back towards the 50% rate by the All-Star Break. The missed shot rate dips, while Montreal finds the net more often.
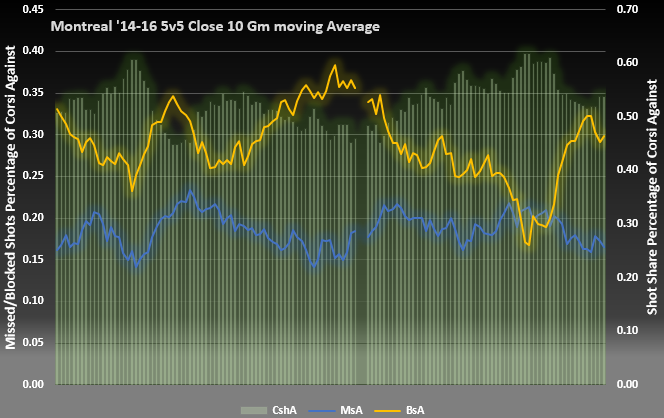
The Corsi Against shot share in the chart below is telling. In games close situations, Montreal allows an awful lot of shots on goal, blocking less until recently, with missed shots holding steady in a range. A good starting point to find out reasons why could start here. Are they outworked, or mishandling space, allowing opponents to fire at will? Sporting a shot share approaching 60% is not ideal, especially when your MVP caliber goaltender heroics aren’t available.
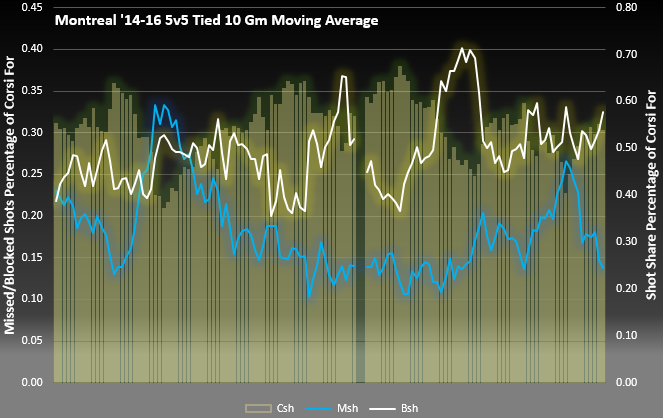
Filtering down to game Tied takes away some more data from the two categories above (Score adjusted, then less data with Close) and taking data away isn’t optimal. From Score Adjusted, to Close, to Tied, the data set diminishes and the charts aren’t as smooth as the previous categories.
Even so, when the game is tied, early season success to get shots through was squelched with a spiking blocked shot percentage, hitting 40% at peak with shot share dipping to under 50%. What were they doing to facilitate such a sharp rise in blocked shots?
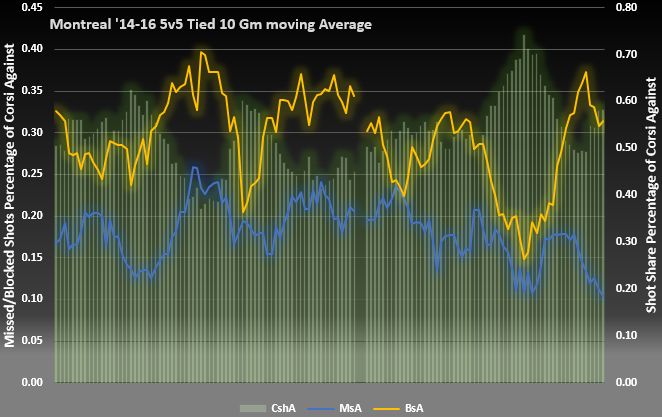
As the offensive game sputtered, the Corsi Against trend spiked of shots allowed hitting close to 70% leading up to the All Star Break as blocked shots and missed shots dipped simultaneously.
This chart is simply ridiculous as blocked shot share cratered coinciding with a drop in missed shot share, while shots sky-rocketed to peak over 70%.
There’s recent improvement, but it’s fairly clear, the issues plaguing Montreal stem much deeper than an injured goaltender, and more about team structure. That falls on coaching and system play. The downturn here while games are tied has more to indicate the type of game Montreal has been playing, with less emphasis on the goaltending. Righting the ship could be a challenge.
************************
Follow the McKeen's team on Twitter: