


Last week I presented the Top 30 NHL scorers game by game breakdown of their aggregated Fenwick and Corsi events. I've always been a bit skeptical about weighting these stats at the player level.
Using the timeonice.com I was struggling with how to present the data for teams instead of adding all players events together for a full total. It would not have been a true indication of the team's overall performance since each event would be represented multiple times for each player on the ice at the time.
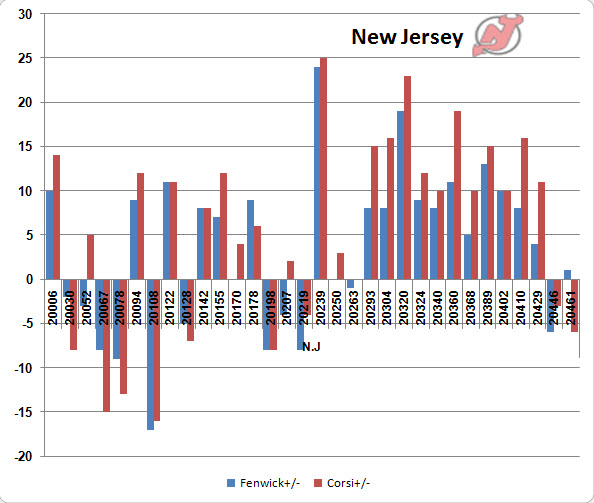
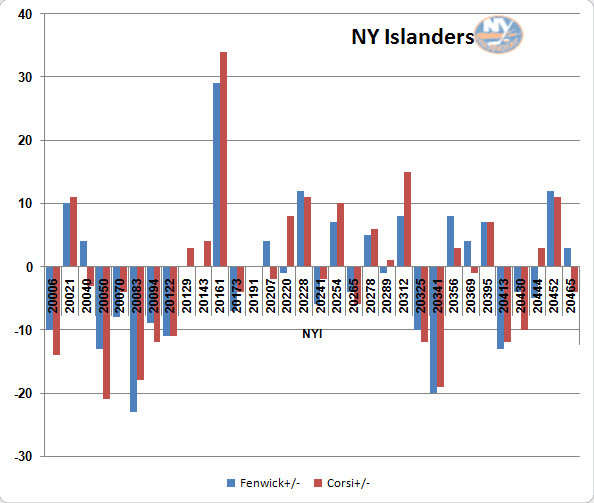
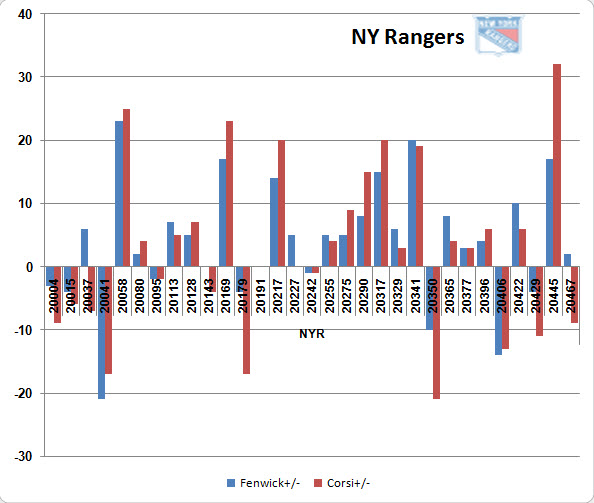
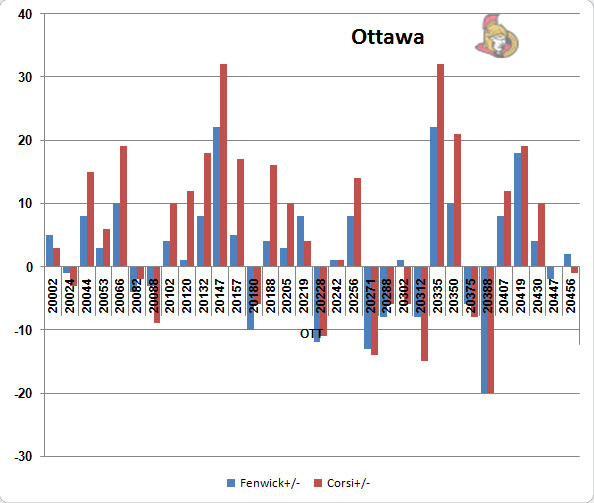
Fortunately, the application also applies events for goaltenders, and since they are always on the ice (save for some time off with the extra man attacker and on delayed penalties - a minor glitch in the overall sample) the numbers are a good indication of team game by game performance. Many thanks to Bruce McCurdy of the Edmonton Journal for some valuable input to aid here.
Eventually, i would like to present this as a representation of each of the individual components involved in each statistic's make up; shots on goal, missed shots and blocked shots (Corsi only). The step after that is automating it and making it interactive for users to be able to use their own input parameters and customize their charts. One step at a time.
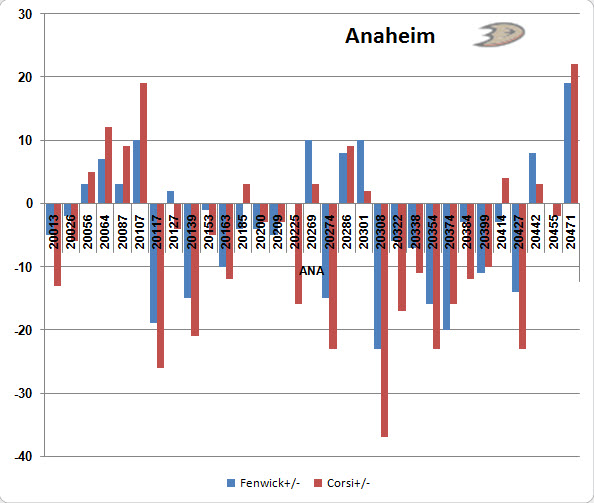
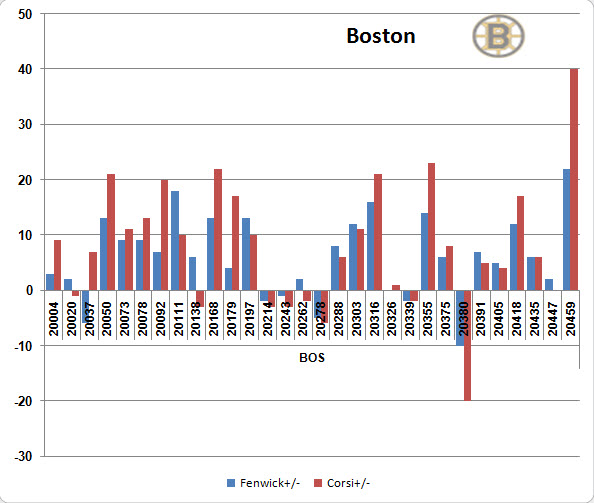
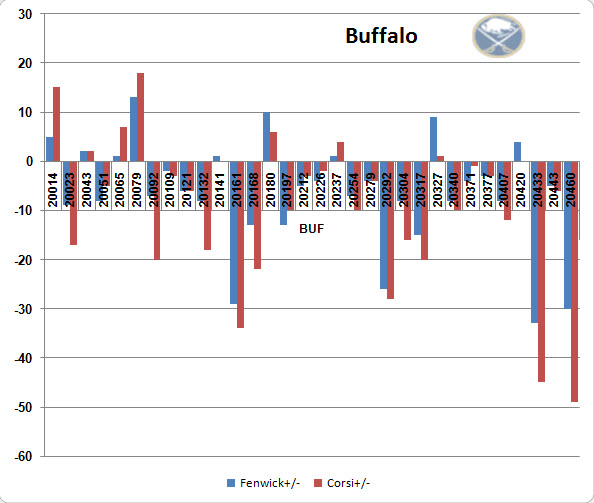
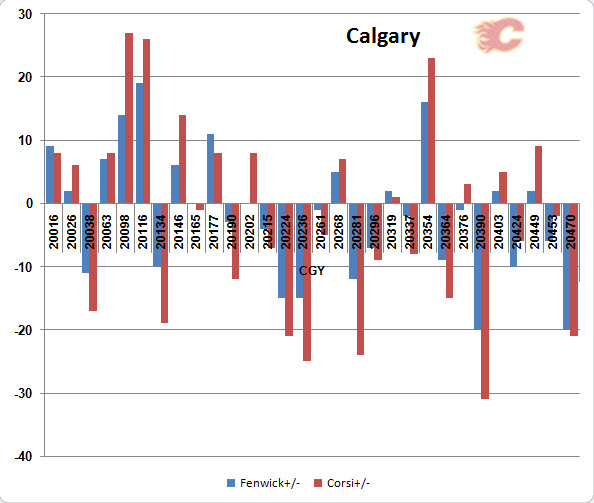
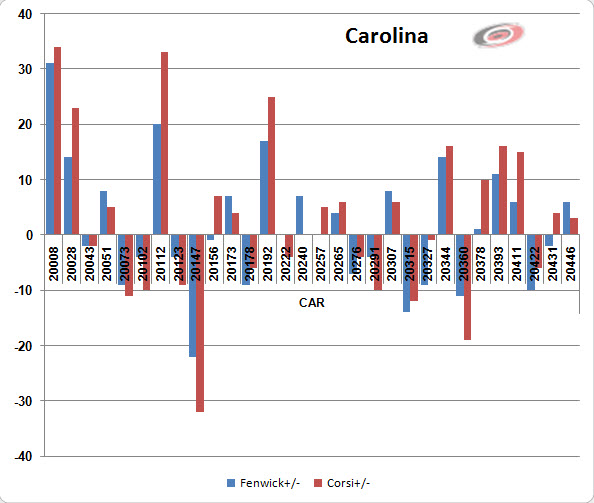
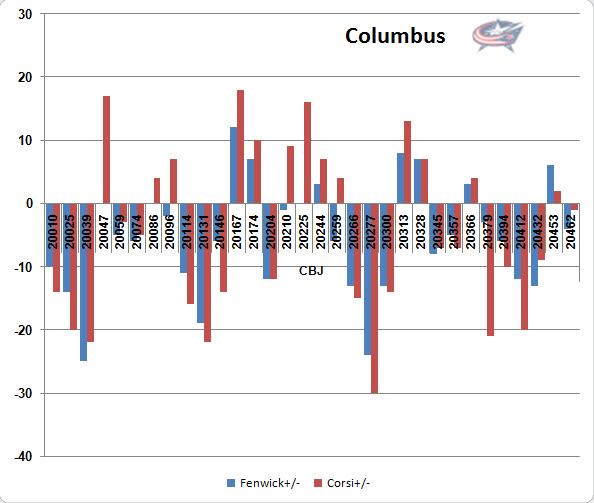
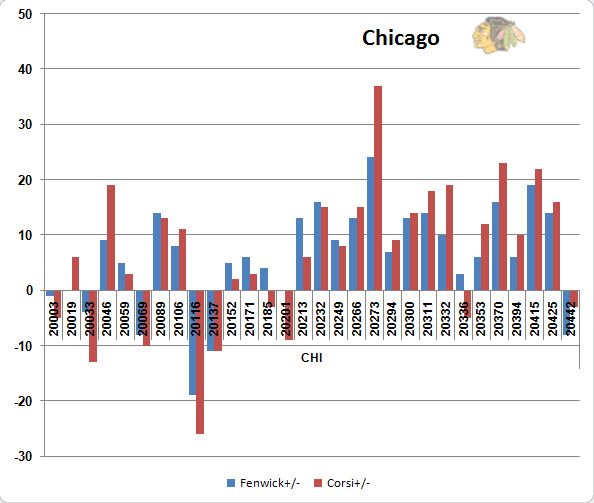
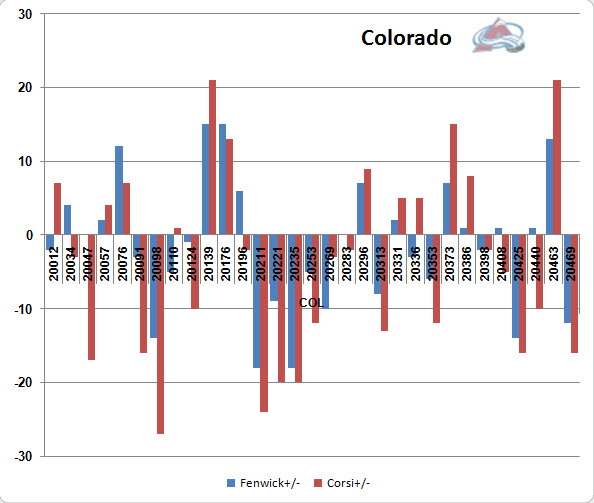
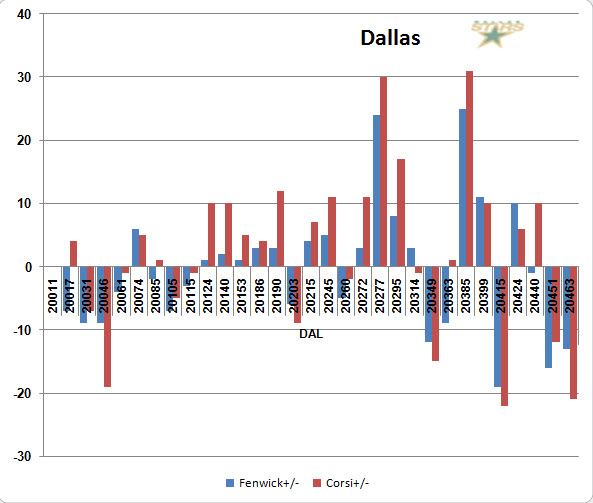
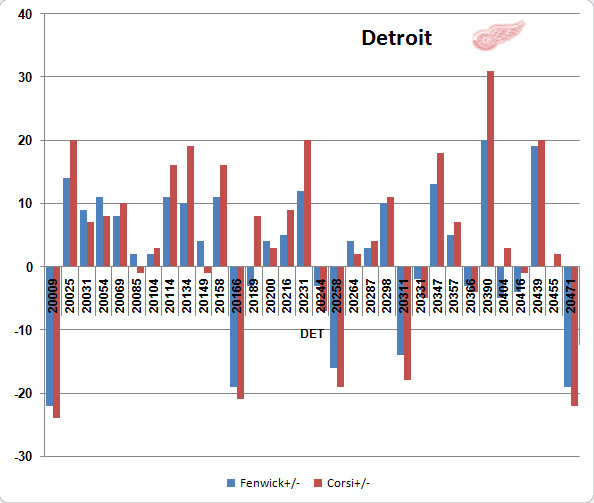
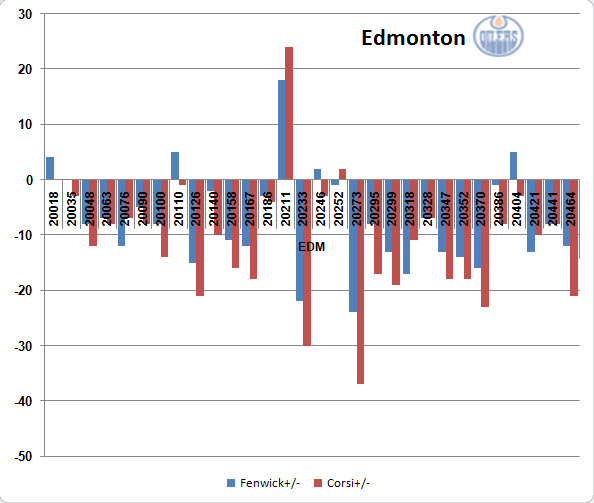
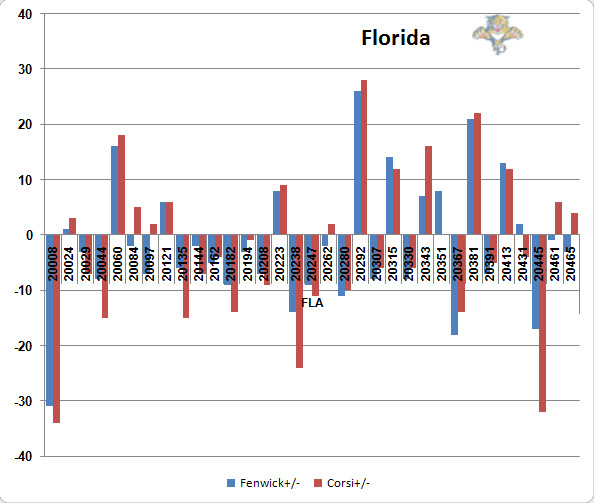
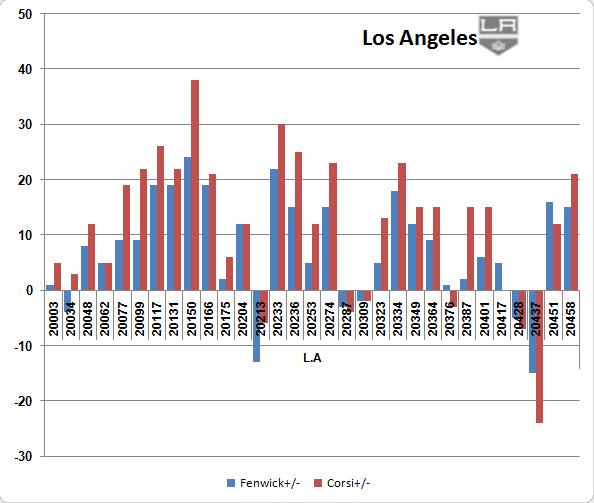
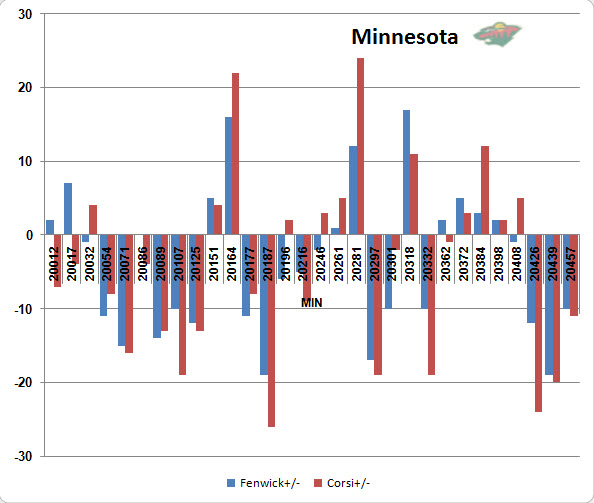
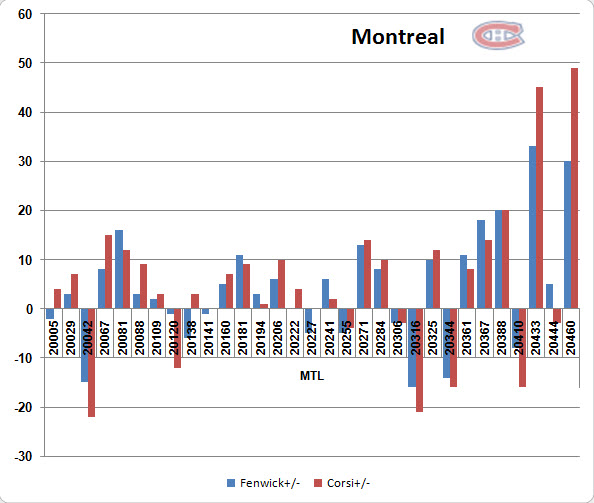
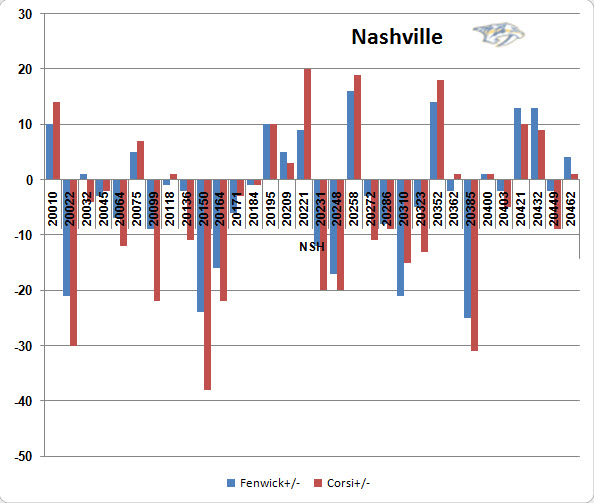
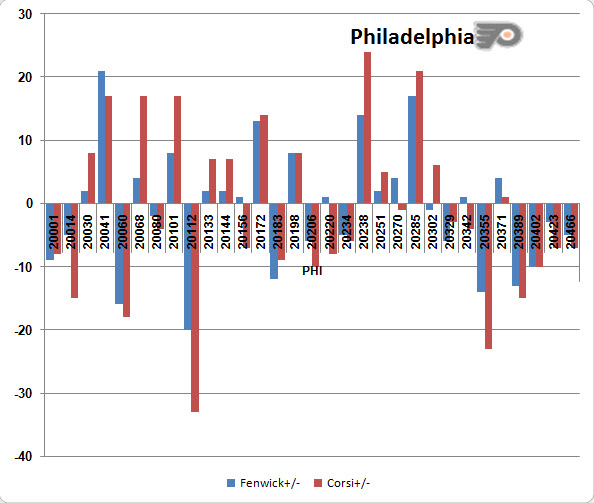
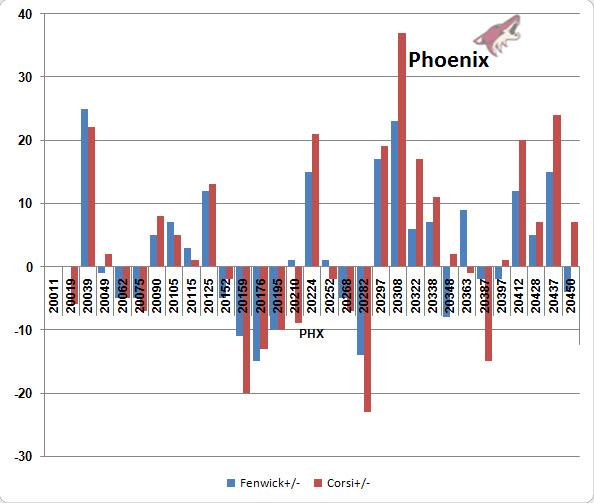
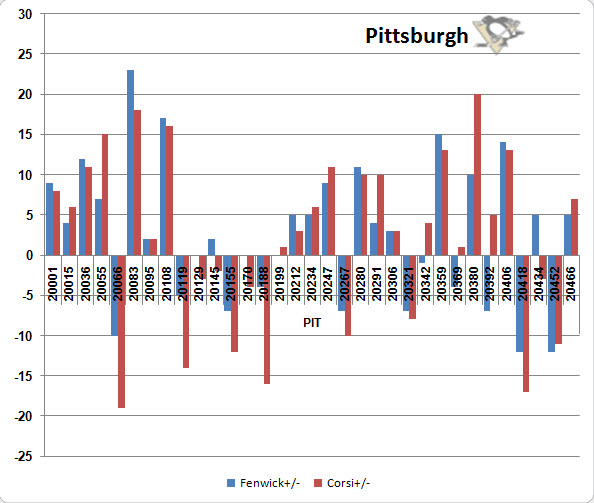
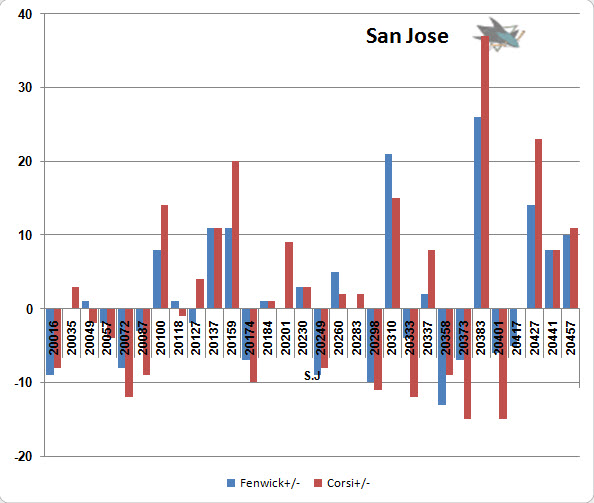
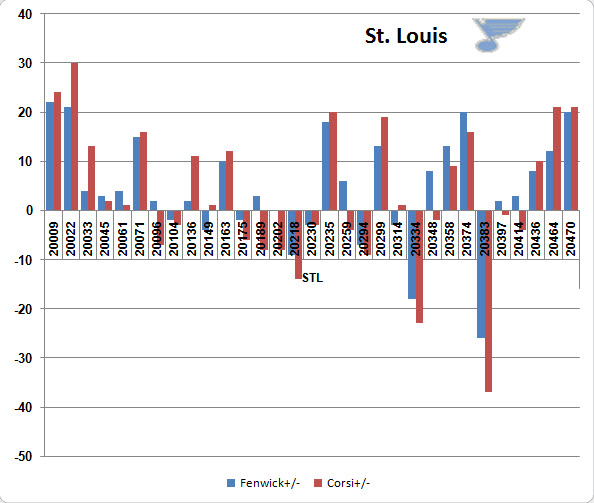
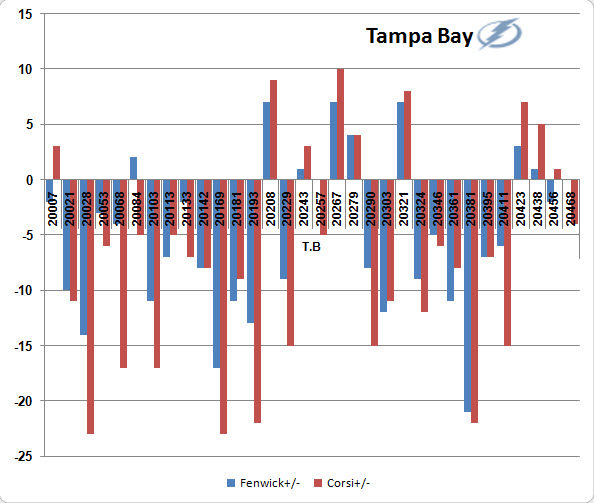
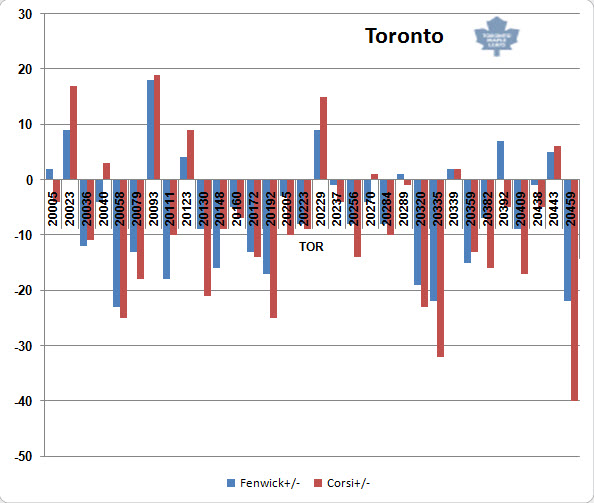
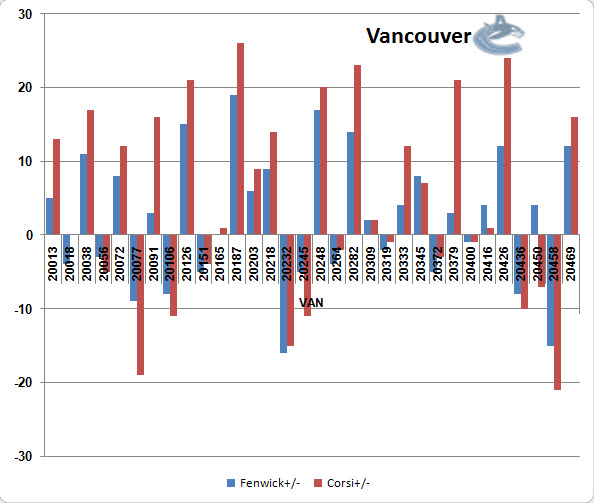
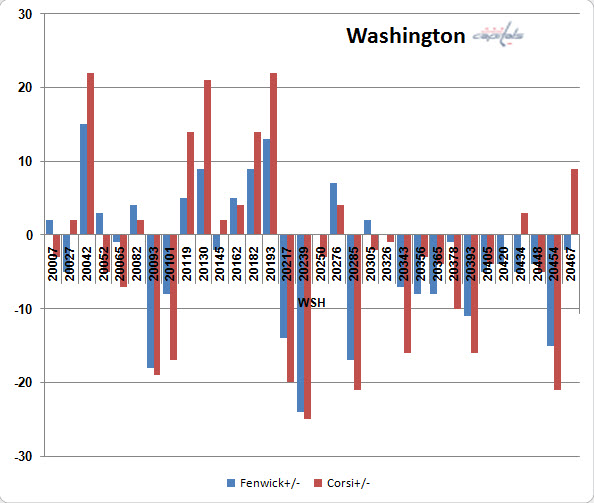
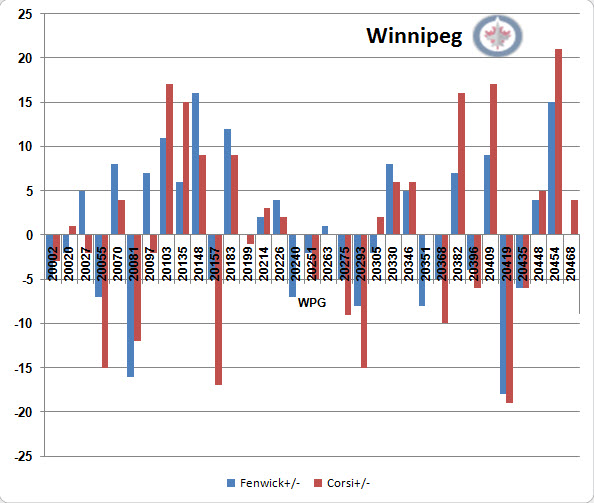
These are the even strength events as described in the previous post only at the team level.
Data is accumulated by using teh timeonice.com application for individual games and then consolidated into a master list. Game numbers are posted along the horizontal axis.
Data includes all games as of Sunday March 24, 2013.
Follow the McKeen's team on Twitter:
@KatsHockey
@mckeenshockey