


REFINING THE SCORING CHANCES DISCUSSION
Last season on this very forum, I expressed my desire to contribute to the so-called “microstats” movement that is well under way among hockey observers commonly known as “hockey nerds”. If you are a frequent visitor of this great website of ours, you are most likely familiar with the concepts of Corsi and Fenwick. These relatively new statistical tools have already helped push our understanding of hockey’s inner-workings to a new level.
Corsi and Fenwick indicators were made possible as soon as the NHL decided to track all shot attempts on goal. Anybody who has watched enough hockey immediately recognizes the limitations of such an all-inclusive data compilation: not all shot attempts are created equal as it pertains to their odds of ending up in the net. Hence the more refined, albeit still fuzzy concept of scoring chances.
The idea of recording scoring chances is far from a novelty. There is a common belief among data-gathering historians that at least some NHL teams were tracking some version of scoring chances in the early 80’s. The problems are: 1-the data was never (and still isn’t) made available to the general public, and 2- there is no real set standard in the way the statistic is tracked by different people.
The correlation between Corsi, Fenwick and scoring chances has been proven by many well-intentioned individuals who worked on the “scoring chances project” a couple of years ago. My objective here is not to refute this established connection but to re-define the concept of the scoring chance in order for it to reflect a modern game that bears little resemblance to the one we watched in 1980. Back then, any shot attempt from the “scoring area” was thought to have a much higher chance of resulting in a goal than any other shot.
Although this might still be the case, the size and speed of today’s players, the advances in defensive coaching methods, the recent predominance of shot-blocking and most of all the much-improved quality of the goaltending are all factors that render the currently accepted definition of a scoring chance obsolete. Here is the current consensus definition of a scoring chance, as explained by Derek Zona of SB Nation:
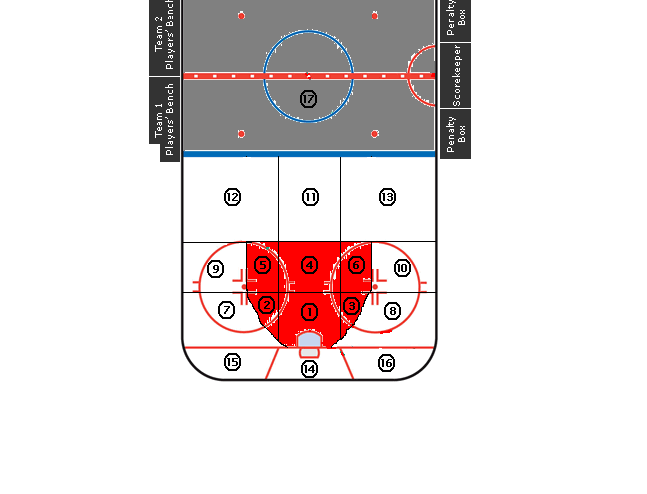
“A scoring chance is defined as a clear play directed toward the opposing net from a dangerous scoring area - loosely defined as the top of the circle in and inside the faceoff dots (nicknamed the Home Plate), though sometimes slightly more generous than that depending on the amount of immediately-preceding puck movement or screens in front of the net. Blocked shots are generally not included but missed shots are.”
I’ve highlighted the sections with which I have reservations. I do agree with the definition of the scoring area (that I will refer to simply as the “area”). Here is an image of the area as I see it (note that I’ve divided the ice into separate “zones” for future advanced scorekeeping consideration):
Today’s offenses have had to adjust to superior goaltending by either: 1-trying to constantly change the point of attack with quick puck movement, deflections or purposely throwing the puck into traffic within the area (hoping for a deflection, bank or rebound off the goalie), or 2-trying to limit the goalie’s vision by creating screens (occupying the space directly between him and the puck at the very moment a shot is fired). Consequently, when re-defining the scoring chance our perspective must shift from the offensive team’s point of view to the opposing goalie’s. This being established here is my revised general definition of a scoring chance:
“Any un-blocked attempted shot on goal from the area that has enough momentum to reach the back-boards will be recorded as a scoring chance. Shots from outside the area that will be recorded as scoring chances are the following: flush back-door shot attempts (one-timers, rebounds, off turnovers) that force quick cross-crease movement by the goalie, screen shots on goal, deflections or banks on goal (without significant drop in original velocity) and flush one-timers on goal off a hard lateral pass. Note that deflections or banks can come off defenders, bad ice (shooting the puck upwards) or bad boards (off a stanchion on a hard dump) and must hit the net in order to be recorded as scoring chances.”
This brings us to the heart of the matter: scoring chance quality. Here is what one of the most respected advanced hockey stats web sites, nhlnumbers.com, has to say about the touchy subject of shot quality:
“First, while shot quality is undoubtedly a thing, its impact is actually quite small. You can find pages and pages online of pixels spilled in the shot quality debate. But at the macro level, any impact of shot quality is going to be lost in the noise and normal fluctuation produced by luck and any other factors that are not quantifiable. And that's the second thing, nobody has found a way to quantify shot quality.
Is it based on distance? Location? Just an innate ability? Well how would you measure that last one?”
The questions I pose then are: What if we could make sense of “the noise” by recording data at the micro level? What if we could find a way to quantify shot quality? What if doing so could help us measure individual players’ ability to create scoring chances, or to finish on them? What if we could translate context into hard data?
We can’t simply explain away events not recorded by Corsi, Fenwick or PDO by evoking pure luck (or randomness) until we at least attempt to record more scoring chances-related events for further analysis.
So the next step will be to take full inventory of the different types of scoring chances and categorize them by grade, according to their likelihood of resulting in a goal. Same time, same place next week and all will be revealed.