


A short post today, just to show some of the contrast in playoff teams, in particular the difference between three teams, all from the Northeast division. Boston, Ottawa and Toronto all offer a different game-by-game corsi breakdown that offers an eye-opening glimpse into each team.
All three clubs are likely to secure a playoff spot soon, each having it’s own dynamic. The Bruins have been the class of the East since their Stanley Cup win. The Senators have been decimated by some devastating injuries, yet remain in the playoff hunt. Their game-by-game chart, however, doesn’t look remotely like a team decimated by injury. Without any prior knowledge of the club, just by looking at their image, one couldn’t quickly identify them as Ottawa.
The Leafs, on the other hand, are an interesting study and a different animal all together. I'm definitely not the first to point this phenomenon out as anyone following using advanced analytics can easily spot this problem.
OTTAWA SENATORS
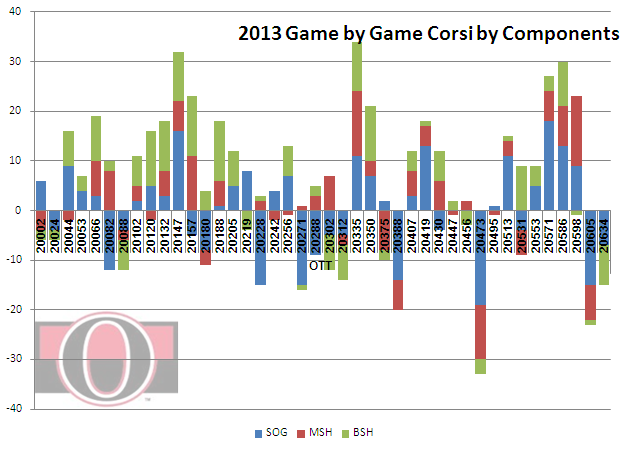
This is the game by game Corsi breakdown for the Senators. Keep in mind the length of injuries to some key players among others and including the bumps and bruises from the group remaining in the lineup. Jason Spezza, Erik Karlsson and Craig Anderson, Milan Michalek, all key players that missed time, but the chart doesn’t seem to reflect that.
Here’s the explanation:
*** Note the numbers on the horizontal are the game numbers (I haven’t figured a way to capture the opponent yet, but that will come).
A quick reminder, Corsi is presented as a ratio, and is the differential of (shots, missed shots, blocked shots) directed at the opposition net minus the same criteria against your own net at even strength. Positive values indicate more pucks were directed at the opposition goal than at your own goal.
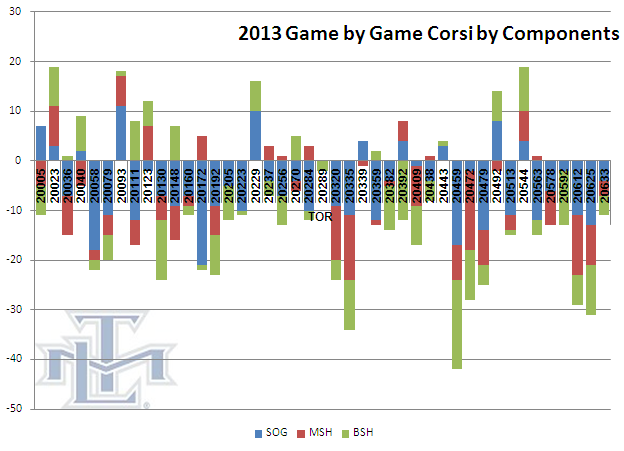
This chart below represents the calculated differential as part of the overall make up of their Corsi.
In other words, this represents the makeup of the individual components on a game by game basis.
When taking the injuries into consideration, it’s incredible that the Senators have as many positive Corsi games.
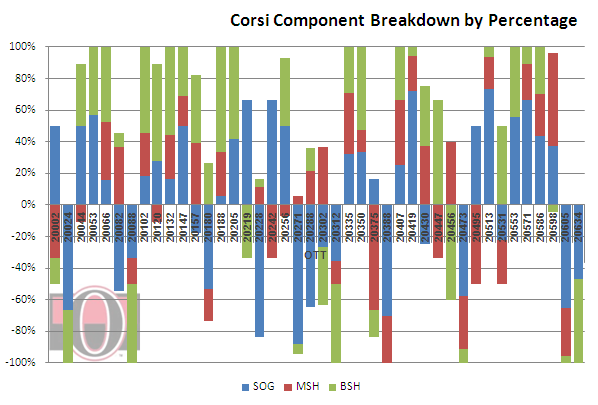
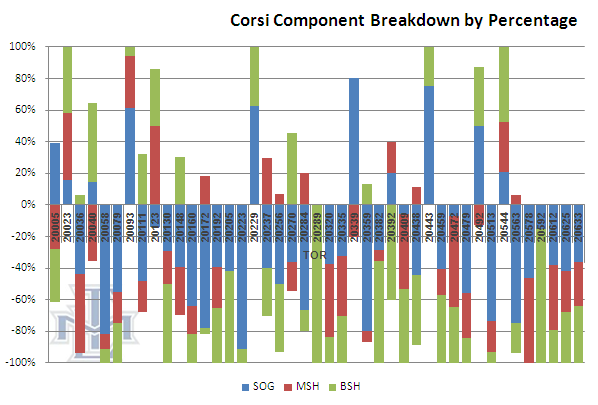
In this next image, the values above are represented as a percentage of their individual components.
BOSTON BRUINS
Let’s contrast that with the Boston Bruins.
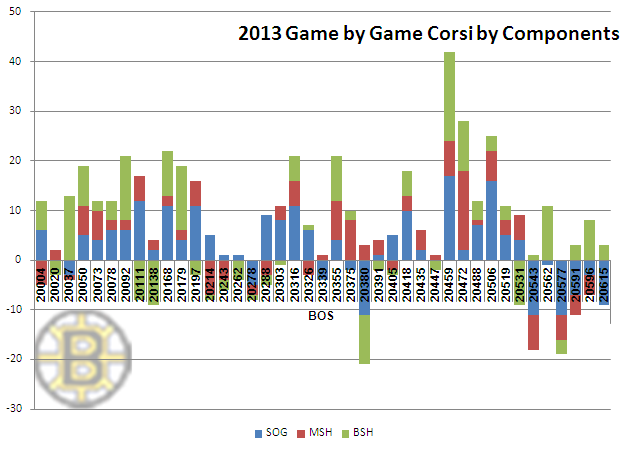
The B’s should be considered an elite team in the East with a solid crease and blueline and depth up front. They have struggled lately. The image below captures that slumping over the past six games.
Boston hasn’t exactly been a powerhouse, but they are usually on the positive side of the ledger. At game 20543, it looks like the trouble started.
They were being outshot as per differential and at the same time, the differential of blocked shots is the lone positive component.
My interpretation would be that as the B’s are sending a lot of pucks in to traffic rather than through seams.
The fact they have a negative differential on missed shots is another indication that they likely aren’t missing a lot of shots, in conjunction with competition missing a greater number of shots on goal and pulling the differential down.
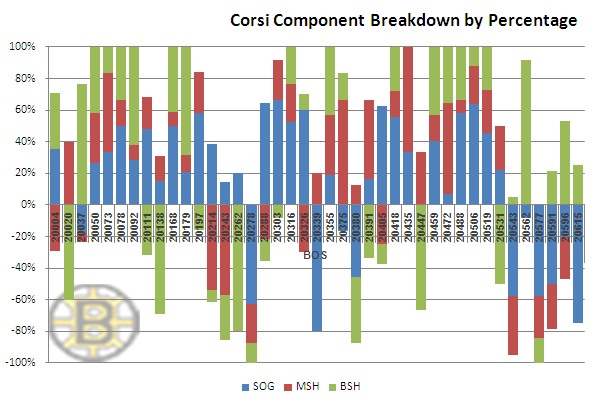
The percentage breakdown by component mirrors the six-game slump shows that most of the Corsi makeup has been dominated by the shots differential on the negative side, and the shot blocking component as the only positive. Boston has to get more pucks on net.
TORONTO MAPLE LEAFS
Let’s take it a step further with the Leafs.
This is the fifth overall team in the East Conference less than a handful of points from the division lead.
A closer look at their chart shows a clear difference between the Senators and Bruins. This is a team that should, for all sense and purposes be missing the playoffs, and considered a bottom feeder.
This is a telling image, especially when comparing to the images above.
As a side note, the last two games against the New Jersey Devils and the Washington Capitals on back to back nights as captured by this image is telling. Against the Devils (game number 20625) the Leafs clearly were outshot, had more shots miss the net and required more blocked shots, yet they came away with a 2-0 win.
In Washington, the raw numbers showed less of a differential, yet the Buds were blown out 5-1.
The percentage image also mirrors this breakdown.
While the Leafs have been on a roll and have likely secured a playoff spot, can bask in the achievement of finally making the playoffs for the first time since the NHL stopped recording tie games, but this breakdown shows a chink in the armor that could be fatal come playoff time.
Data is courtesy timeonice.com
Follow the McKeen's team on Twitter:
@KatsHockey
@mckeenshockey