


I started looking at the Ottawa Senators for the McKeen’s Hockey Yearbook recently setting up my database to filter specifically for Senators criteria. The game watching and scouting notes are one component but it isn’t a focus for the purpose of this writing.
I do this with every team before getting into the meat of the player analysis giving me a proper representation of high-level team performance before micro-analyzing player contributions.
While going through some high level charts, I noticed a fairly interesting pattern for the soon to be departed, Jason Spezza (if one’s to believe the chatter surrounding the Sens captain). In particular, the effect from the 2001 1st round selection (2nd overall) in close games especially in comparison to the second line of Kyle Turris, Clarke MacArthur and Bobby Ryan.
Spezza spent most of his 5v5 playing time alongside Milan Michalek (680 minutes) with a revolving third to round out the line. Of the 627 minutes Spezza spent in games close (comprising about 62% of his 5v5 time and 25% of the Sens total games close ice time) 350 minutes were with Michalek on his flank. Games close is comprised of the score within 1 goal in the first two periods or tied in the 3rd.
This table below shows the breakdown of time on ice at 5v5 and in games close. The last two columns are the percentage of total team time spent in 5v5 and in games close. Spezza spent approximately 26% of his 5v5 time in games close. The Tied/Lead/Trail % is the percentage of time on the ice in those game situations.
| Player | 5v5 | 5v5 Close | close % | Tied% | Lead% | Trail% | % of Tm 5v5 Ice time | % of Tm 5v5 Close |
| JASON SPEZZA | 1002:12 | 627:51 | 62.65 | 36.81 | 28.35 | 34.84 | 26.38 | 25.98 |
| MILAN MICHALEK | 1048:49 | 667:14 | 63.62 | 38.81 | 28.44 | 32.75 | 27.61 | 27.61 |
| KYLE TURRIS | 1112:18 | 704:08 | 63.3 | 39.44 | 29.02 | 31.54 | 29.28 | 29.14 |
| CLARKE MACARTHUR | 1004:09 | 643:18 | 64.06 | 40.12 | 29.73 | 30.15 | 26.43 | 26.62 |
| BOBBY RYAN | 937:22 | 562:40 | 60.03 | 35.73 | 28 | 36.26 | 24.67 | 23.28 |
Let’s go into the charts, starting with the Senators charts overall.
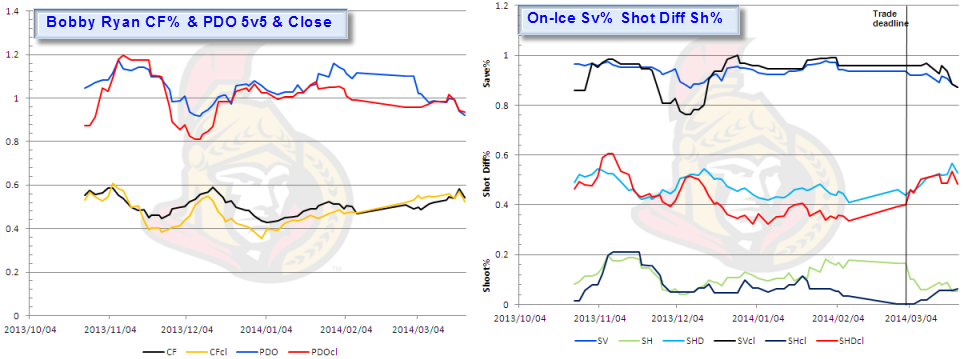
The charts are visual representations of the Senators 5v5 10-game rolling moving average Corsi For% and PDO (with accompanying games close numbers). In addition, (with more comprehensive data) is the elemental breakdown of the team’s PDO into its base components, on-ice save- and shooting percentage for a micro investigation of each component’s overall effect. By a degree of extension, I added shot differential. Once again, this is at 5v5 and in games close.
The graph on the left is the CF% and PDO breakdown and the graph on the right is the PDO core components. Pay attention to the ‘close’ lines and notice the overlap within the time period of mid-November through to the trade deadline (click to enlarge the images).
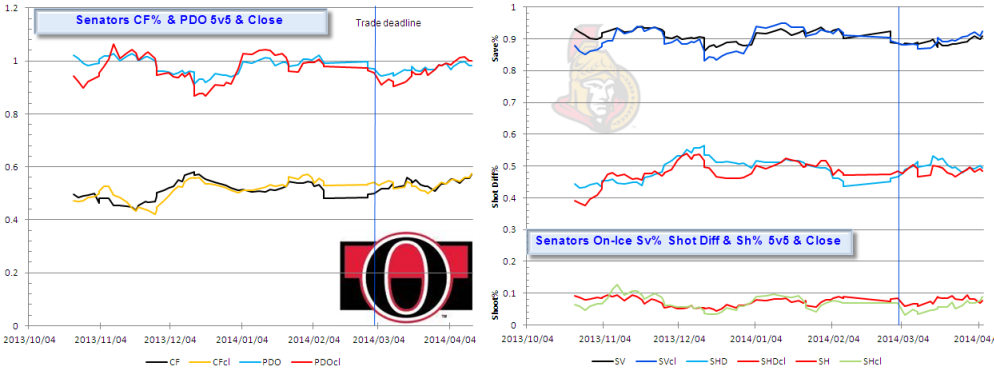
The second graph (right) represents PDO in its core components; on-ice save percentage and shooting % and I’ve added 5v5 shot differential.
The theory here is the games 'close' line should be above the overall lines. A higher close line represents the score effects that drag down the leading team’s overall Corsi. Strong performance when games are close likely results in leads and teams then have a tendency to play prevent, allowing the opposition to rack up shot attempts against and in turn increasing their Corsi through score effects, while reducing the leading team's Corsi. Conversely, a team that's get's behind will have a lower CF% close and then the opposite description, racking up shot attempts and increasing the Corsi rate (and line).
I've included the individual charts for Spezza, Michalek, Turris, MacArthur and Ryan.
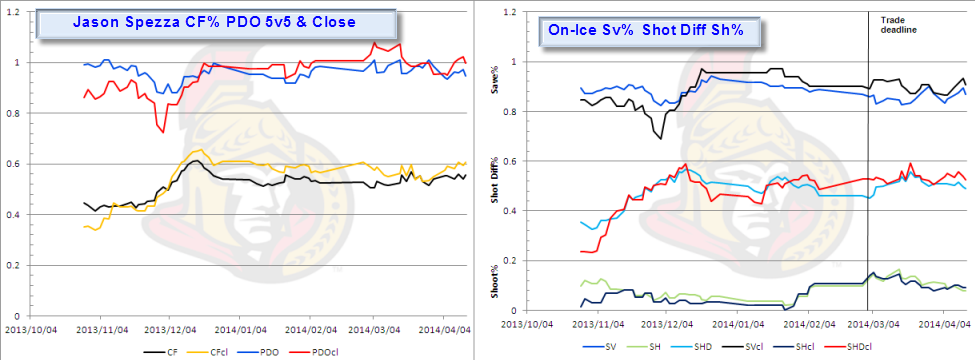
Look at Spezza’s CF% close line how it hovers above the CF% overall percentage after mid-November. That piqued my interest with the interpretation that he was effective with games close. Splitting his on-ice stats is even more telling and the addition of Hemsky after the trade deadline was killer. Spezza’s Corsi jumped to 56.9% alongside Hemsky.
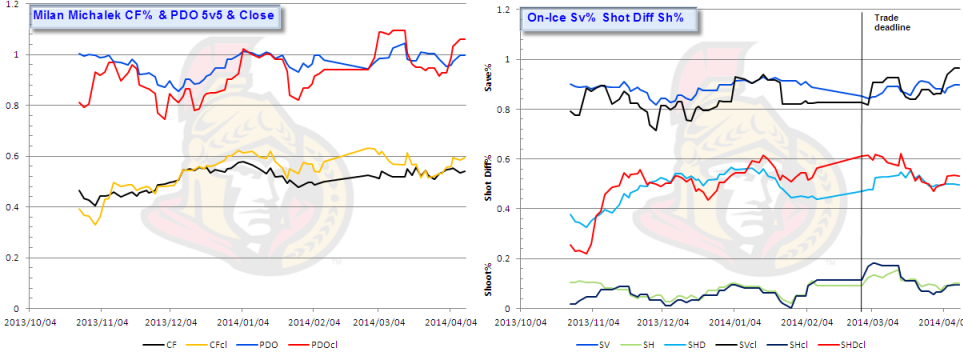
I've included Michalek his most consistent linemate, where the images tend to mirror each other.
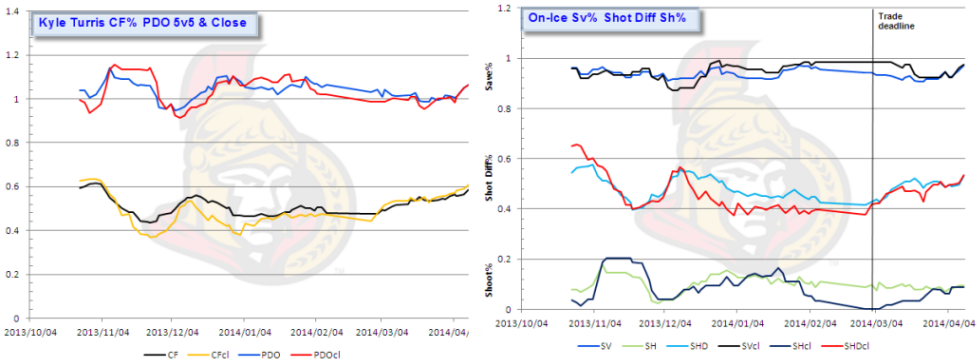
Now, lets contrast that to the Turris, MacArthur & Ryan line with attention to the 'close' line.
First Turris.
Then Bobby Ryan who had season-ending sports hernia surgery towards the end of March.
Last is former Sabres, Thrashers and Leafs winger, Clarke MacArthur.
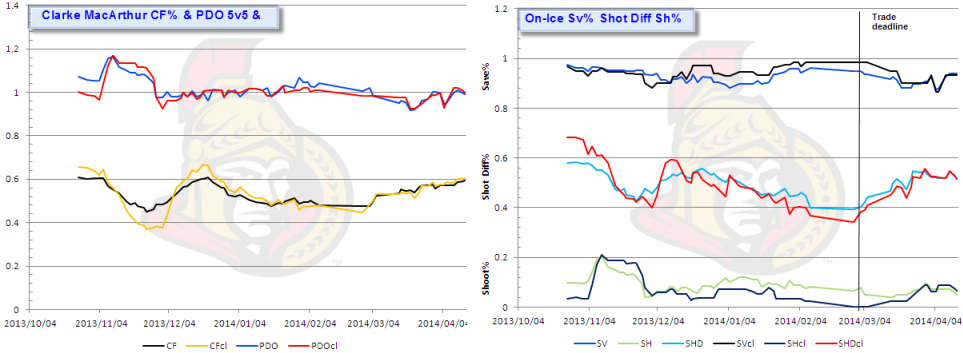
The common theme for all of them is the CF% overall line hovering above the CF% close – less so for MacArthur than for the other two linemates. That line was the driving force early in the season, but seemed to sputter after mid-November until after the trade deadline.
There were three distinct periods to the season that we could break into for a deeper look at the player’s impact. Jason Spezza missed four games at the end of the calendar year and it coincided with the Sens Corsi leveling after a period of ascension and slight correction. I split the season into these three markers:
Nov 17 – Jan 2, 2014
Jan 4, 2014 – Mar 2, 2014 (trade deadline)
Mar 4 – end of the regular season
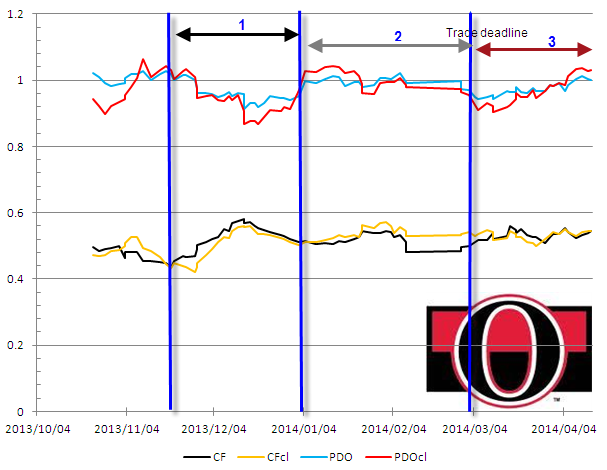
Isolating the season into those three components, I took the average CF% and CF%close, along with PDO (close) and the core components. I included total goals for and against (overall and close) with a summary of the Spezza/Michalek pairing (along with Hemsky in the third period after his acquisition from Edmonton) and the Turris, Ryan, MacArthur line.
Period 1
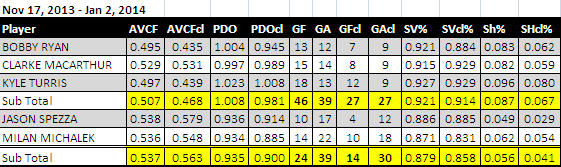
During this period, Spezza/Michalek averaged a 56% Corsi close, with the Turris line hovering at about 46.8%, a sizeable difference. Goaltending via on-ice save percentage and a low on-ice shooting percentage played a big part here for the pairing as the Turris line shot at a better rate, while receiving average goaltending in games close, with above average overall at 5v5.
It’s more of the same in the next period and confirming the CF% line in the charts above for the Spezza/Michalek pairing. I chose the trade deadline, not only because of the convenience, but this was also the final period before the addition of Ales Hemsky, acquired from Edmonton, that had a distinct impact flanking Spezza.
Period 2
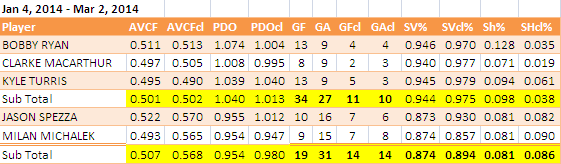
There’s still a considerable gap between the pairing and the Turris line. A 6% difference is fairly substantial, while goaltending buoyed the Turris line, they scored almost two-thirds of their total offense after the game changed from close to blowouts. The Spezza/Michalek pairing averaged on-ice save percentage of .894 close and .874 overall, yet scored 14 of their 19 goals in games close situations – with 50% of their goals against during ‘close’ game situations as well – relative to the Turris line having almost one-third of their goals-against during games close.
Period 3
The final period is directly after the trade deadline, with the distinction of the addition of Hemsky.
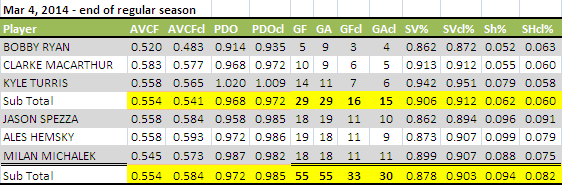
Hemsky’s impact was special from those that watched him in Senators silks, but these numbers show just how significant he was, leading the way with a 59.3% Corsi close. The Turris line (sans Bobby Ryan towards the end) blew up soon after the deadline, with a 54.1% Corsi close, still not eclipsed by the Spezza line at 58.4% overall. They also enjoyed the most productive period in terms of shooting percentage overall, with the close average hovering around the 8% mark.

Kyle Turris had his breakout year, clearly becoming an important component up the middle for the Sens, flanked by two players that bring a distinct skill set, Ryan as a shooter and MacArthur as a support player. The former played injured for the majority of the season – that may have affected his overall numbers after a killer start – while MacArthur blended into the scenery for periods at a time.
The most consistent element for the Senators forward was Jason Spezza who along with Milan Michalek contributed the most during the most important periods of the game. Losing Spezza, as the rumors would indicate of a potential trade out of Ottawa is going to be a substantial blow to the offense. Losing both Spezza and Michalek even more detrimental.
Then there’s Hemsky.
Even if Mika Zibenajad is capable of filling the void, I’d be somewhat weary of the immediate impact and whether the Sens could create offense if teams key in to the Turris line and effectively shut them down.
According to this micro-study, Spezza isn’t replaceable with anyone on the current roster, within the system, and they won’t recoup the loss through any potential trade.
In short, should the Senators trade Jason Spezza and let Michalek walk as a UFA, without improvements in goaltending or blueline upgrades in 2014-15, Spezza’s replacement could very well potentially become Connor McDavid.
Data sources:
**********
Follow the McKeen's team on Twitter: