


Thanks to Greg Sinclair for providing the data. Follow Greg here: @theninjagreg
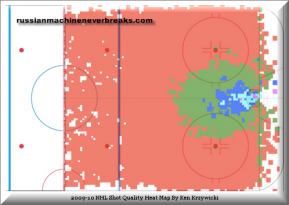
It’s clear how much I value players getting hard to the net as part of goal scoring success. The heat map is a good visual of the importance along with the images in the Second City link with a more details.
Three Toronto Maple Leafs forwards illustrate three different scenarios.
David Clarkson has experienced scoring success due to getting to the net. James Van Riemsdyk continued goal scoring success relies on tight proximity to the net. Nikolai Kulemin is the exception here, moving away from the net.
Kulemin’s goal scoring decline since a career high 30-goal season in 2010-11, unsustainable shooting percentage & dwindling power play time aside, is precipitated on the lack of incursion to scoring areas. Shooting from the outside is not conducive to scoring unless there is heavy enough traffic for rebounds and scrambles. In effect, it’s a low-percentage play without bodies in front of the net.
Before getting into detail, I wanted to touch on the impact of the word ‘shot’. The immediate visualization is a launched projectile towards target. Shooting in hockey encompasses more than just launching projectiles. A player in front of the net with pucks hitting his backside and going in credits the goal scorer with a shot on goal, when technically, there wasn’t a shot taken. Coincidental contact awards the player with a shot on goal.
This is more evident in scoring success for Clarkson. The newest Leaf winger’s greatest contribution should be as a net presence rather than physical, gritty winger patrolling the walls. Clarkson’s goal scoring prowess wasn’t enhanced by great improvements in his shot or better release mechanics as much as the simplicity associated with getting to the net. Net presence enhanced some shot on goal totals in that effect, such as tip-ins, using strength and better positioning, rebounds and loose pucks turned into goals.
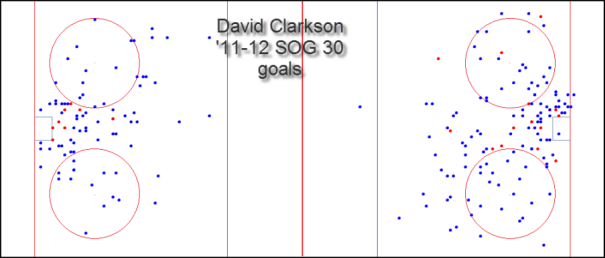
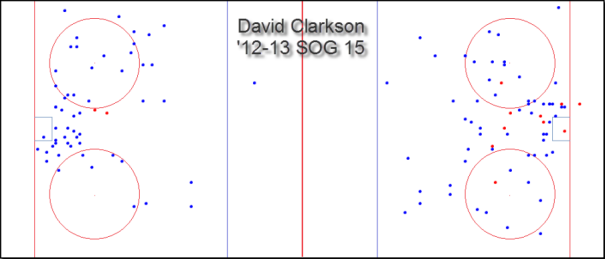
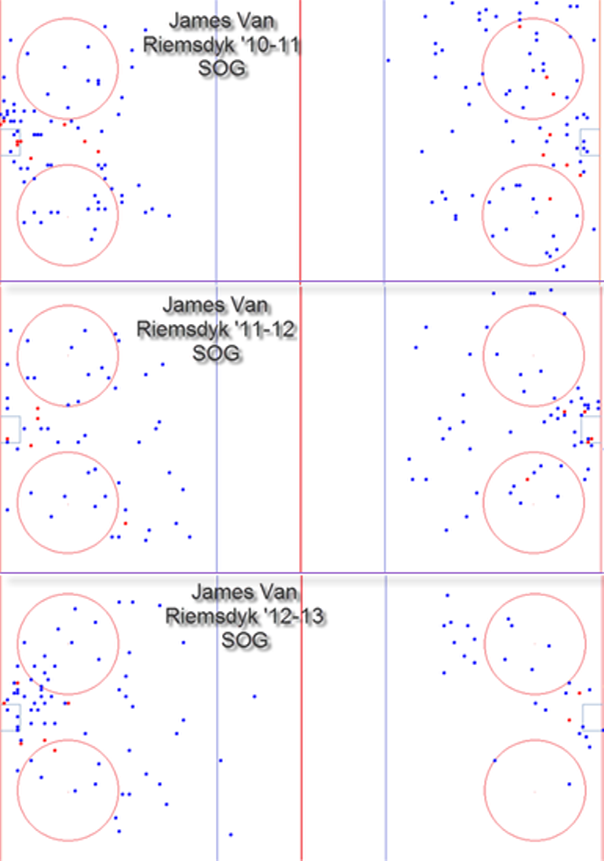
We can view this in the three previous season shot locations for former Devils winger, (images generated via Super Shot Search by @theninjagreg a great resource – blue dots are shots on goal, red dots goals).
The concept here is not just about getting shots from in close. Working backwards from in-close shots, players must consistently get to that difficult area in order for any event to occur, which also results in nothing plays if the puck never reaches there.
It’s a physical and positional sacrifice. The more players get to the net, the more likely impact shots can have with traffic in scrambles/rebounds. That’s the purpose of net presence.
Clarkson’s net presence has evolved into better scoring numbers and he parlayed that into a lucrative long term deal. JVR’s continued net presence should sustain goal scoring ability.
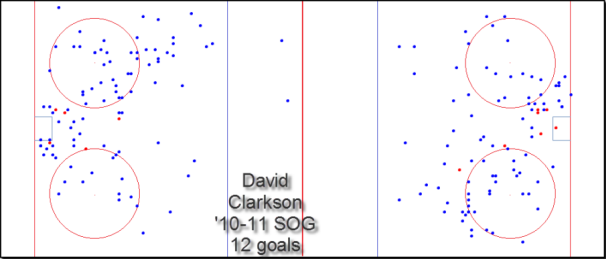
The immediate difference of scattered shot location from ‘10-11 to ‘11-12, with a closer shot concentration resulted in 30 goals. Not solely due to the 200+ shots (an increase from ’10-11), the higher concentration closer to the goal and middle of the heart of the scoring chance home plate factored in.
Shortened ’12-13 didn’t buck the trend as Clarkson continued to instigate the same elements that made him a successful scorer in 2011-12, converting 15 goals. The scatter in shooting patterns could be attributed to that point where players start believing there's a general improvement in skill as they taste scoring success – a plus from shooting quantity perspective, a detriment if the player feels that the skill level has increased enough to overwrite core elements of success. When players start to move away from the characteristics that make them successful the numbers have a tendency to follow.
Not all those little blue dots represent a release-backed shot.
James Van Riemsdyk is an example of varying consistency. ‘JVR’ is not the crash and bash type despite being solidly built.
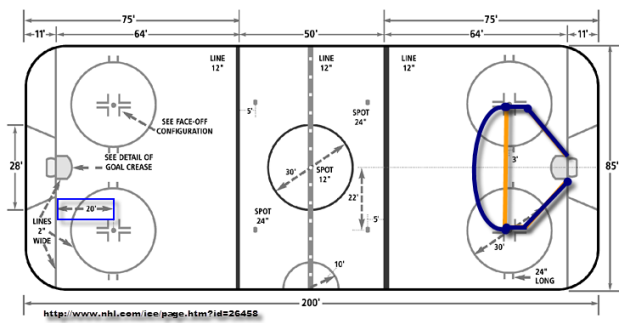
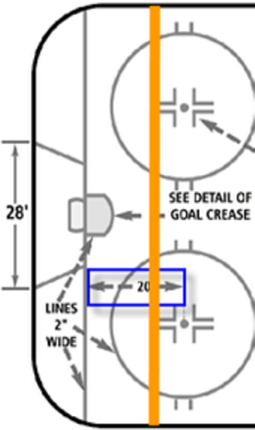
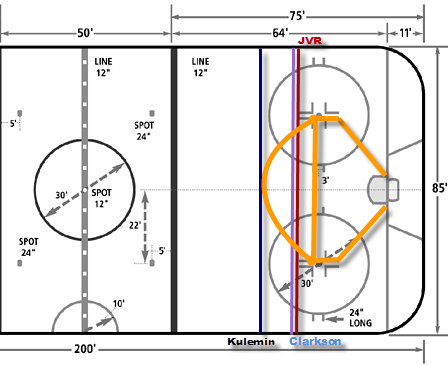
In 2010-11 he scored eight playoff goals, averaging around 24 feet, four feet outside of the face off dot outlined by the blue rectangle in the image below. The scoring chance home plate area is outlined on the right.
James Van Riemsdyk’s shot charts from the past three seasons show a distinct pattern of net presence in ‘10-11 and ’12-13.
The scattered approach in ‘11-12 was indicative of the struggles scoring goals, shooting from a slightly farther distance.
The shot clustering from 2010-11 returned in ’12-13.
In ‘12-13 JVR scored in bunches early, amassing 14 goals in the first 25 games on 84 shots on goal with an average distance of about 25.9 feet. In the remaining 19 games, he scored four goals on 57 shots on goal, averaging about 28.21 feet.
An interesting side note on his first 25 games. Ten games featured an average distance greater than the game average (35.98 feet) scoring six goals on 33 shots (18% sh%). In 15 games, he was shooting closer than the overall average at 19.17 feet – or slightly closer than the face off dot. He scored eight goals on 51 shots (15.6%). These results are a counter to the concept here until we progress through the rest of the season.
In the final 19 games, the average shooting distance was greater than the overall average in 10 games (36.88 feet) on 26 shots without scoring once. In the remaining nine games, firing 31 shots at an average distance of 18.58 feet, he scored four goals.
Size may not matter, but distance does.
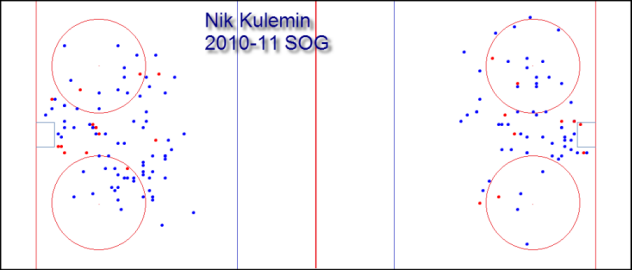
Nik Kulemin is where this pattern changes. The 27-year old Russian has reached his zenith offensively. The disturbing part is the questions that lead out of here. Is he starting the career down slope, before reaching 30?
Aside from the increase in shots on goal from the previous season, there’s a higher concentration of shots in ’10-11 closer to the net/home plate area.
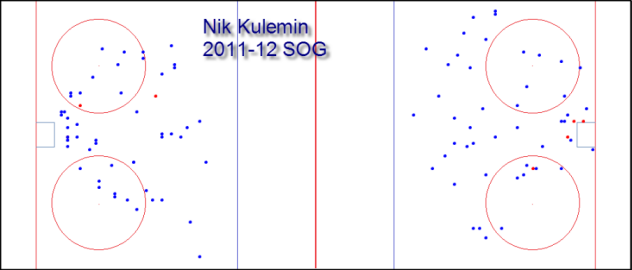
In ’11-12, the shooting patterns are speckled. Aside from a small cluster of shots closer to the goal on the left the pattern is reminiscent of a player firing from the perimeter with occasional forays into scoring areas.
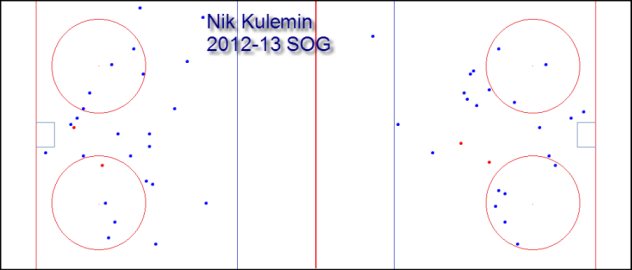
In conjunction with this image from ’12-13 was lining up with Mikhail Grabovski – and we all know what happened there – and Jay McClement. This is a soft confirmation of a sputtering offensive game with the average shooting distance moving away from the goal.
This could be a usage issue.
In ’12-13 Kulemin was almost always the high forward in the zone, laying claim along the top of the faceoff circle. This actually stems from the Ron Wilson days.
In the first 18 games in ’11-12, he scored 2-5-7, and fired 28 shots on goal, the average distance of 21.5 feet. Remove two games where the average distance was higher than the season average and the it drops to 17 feet. He was firing three feet below the faceoff dot.
Then something happened. The rest of the way, he averaged 35.35 feet, a full 7 feet farther than the ’10-11 average of 27.92 feet.
That’s too drastic a change to suggest inherent fault of the player and only leaves usage. Wilson transformed his role to the high forward in the zone and Randy Carlyle just ran with that.
As the high forward, he’s often in position of defensive support leading to a somewhat misleading belief in an extraordinary defensive ability. The visual of solid defensive positioning is built out of role and responsibility rather than strictly instinct.
The worry here is just future expectation and role as he enters a contract year. Does he accept this role or does he start to drift closer looking to enhance his overall numbers? I feel he’s less proactive in this role and doesn’t consistently engage opponents in the offensive and neutral zone. The result becomes a reactive player forced focusing effort in recovery rather than to advance the play.
At 27 years old, a defensive positionally sound forward selectively foraging into scoring areas limits contributions, and in the end, perhaps overall value. That might be the underlying tone heading into the final year before unrestricted free agency.
GRAPHS
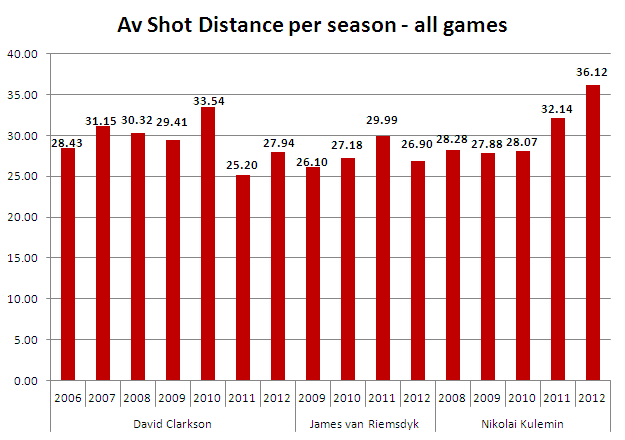
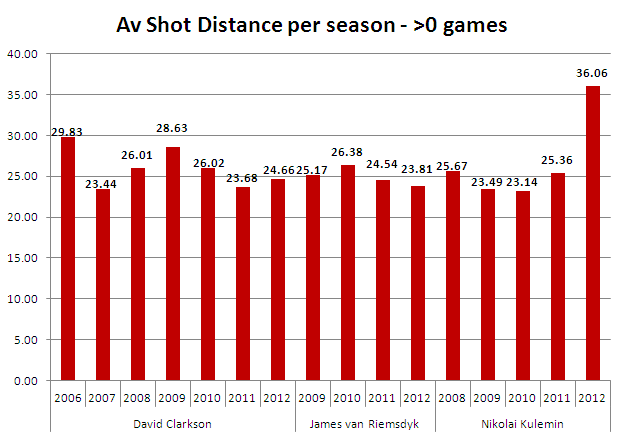
The next three images outline average distance in shots in three distinct situations by season. The first image outlines the average shooting distances per season in all situations where players fired a shot on goal whether a goal was scored or not.
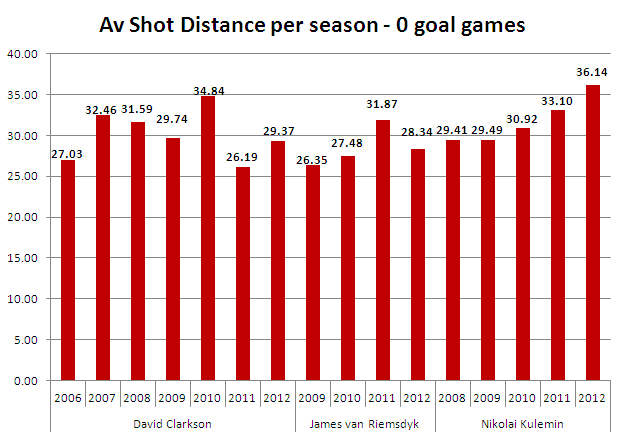
In games where players took at least one shot but did not score a goal, the average distance is greater almost across the board.
In games where players scored goal(s).
This is an outline of the past three seasons, with games played and trend lines.
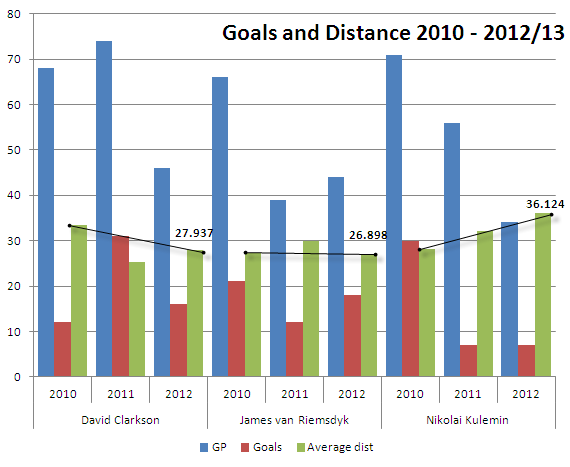
The end result is a 2012-13 average distance delineated to simulate distances in relation to the rink.
CONCLUSION
Clarkson and Van Riemsdyk have reached a comfortable medium as goal scorers, Clarkson less so on natural skill and talent, but more rigor.
For continued success, David Clarkson and James Van Riemsdyk have to continue getting to the net.
Kulemin has slipped into the perimeter as the high forward in the zone, selectively picking his spots to get closer to the goal. Entering a contract year, there's the push of playing within the system, fighting the pull to excel personally for a chance at a more lucrative contract.
Follow the McKeen's team on Twitter:
@KatsHockey
@mckeenshockey