


Robb Tufts is a data visualization professional who has been using Tableau software since 2010. His data visualizations have been featured on Tableau's website as "Viz of the Day" and as winner of the "Evil Viz" contest. He has collaborated with Rob Vollman's Hockey Abstract site and is a regular contributor to St. Louis Game Time. We have included a section for Frequently Asked Questions right below the chart. You can also download the FAQ's here
Data compiled from www.behindthenet.ca and http://www.nhl.com
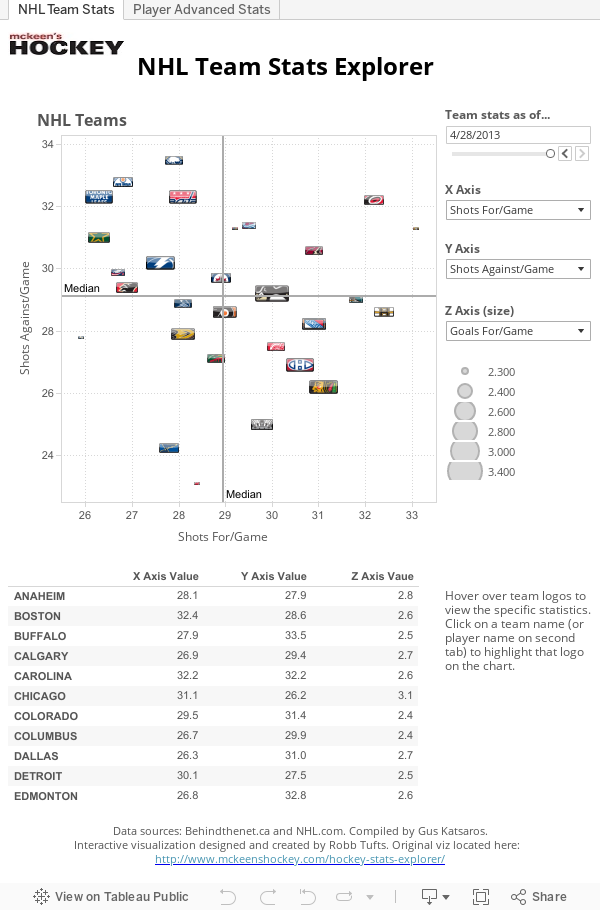
FAQ and Descriptions
- The data for both visualizations was compiled in periodic intervals, daily for NHL team statistics and weekly for advanced stats from Gabriel Desjardin’s cutting edge site, behindthenet.ca.
- Data was stamped with a date to present a cumulative aggregation of the individual categories in the drop down menus as of the date chosen with the slide rule date selector at the top right of each chart.
- NHL Team data includes all games played by the selected team as of the date in the filter. Adjust the filter by using the slider or clicking on the < or > buttons.
- The default date set upon loading visualizations is set to the final date of the NHL season, April 28, 2013.
- NHL team data was compiled starting from January 19, 2013 daily until the end of the season. Advanced stats data begin from Feb 18, 2013 to season’s end April 28.
- NHL Player data is cumulative and includes all games played by the player as of the date in the slide rule selector. Dates for display are in intervals of seven (7) days, since daily change effects are negligible with such a small sample.
- Users can hover their cursor over team logos to isolate specific statistics for that selection as of the date indicated in the slide ruler date selector.
- Clicking on a team name or player name in the table below the chart will highlight the selection in the scatter plot area.
- Users can customize and share specific views via a link, image, or embedded into your own website. Filter and tailor the charts to your specifications, then use the share button at the bottom left to post images or share via social networks like Facebook and Twitter.
- Users have the option of generating a link that can be inserted into a blog or email. The link will send users to a webpage that houses the customized visualization. Embed the entire visualization into your blog or website by copying the embed code.
- A customized image/chart can be exported using the button that looks like a tray with an arrow at the very center/bottom of the visualization.
- The defaults for each axis are highlighted in the next section. Fields that require an explanation will be expanded below. Some fields (particularly in the NHL Team chart options) are self-explanatory. The Z-axis offers the dimension of size of the NHL logo’s signifying various degrees of the default value or any subsequent selection.
- Play around with the different X and Y inputs to create specific charts for your own personalized needs. And above all, have fun.
NHL TEAMS SELECTIONS
Default X-Axis: Shots For per Game
Default Y-Axis: Shots Against/Game
Default Z-Axis: Goals For/Game
Shots For
Goals For/Game
Shots Against
Shots Against/Game
Goals Against/Game
Power play Opportunities
Power play Time
Power play Shots
Power play Goals
Power play Goals Against
Shorthanded Goals Against
Power play %
Total Times Shorthanded
Penalty Kill – Shots Against
Penalty Kill %
Advanced Stats Selections
All definitions can be found on the original site by following this link:
An additional resource for expanding on the statistics and understanding the power of the future of hockey analytics can be found here:
Default X-Axis: TOI/60
Default Y-Axis: Corsi Rel QoC - Average Relative Corsi of opposing players, weighted by head-to-head ice time.
Default Z-Axis: Off Zone Start % - Percentage of player’s offensive zone faceoffs.
Corsi QoC - Average Corsi of opposing players, weighted by head-to-head ice time.
Corsi Relative - On-Ice Player Corsi minus to Off-Ice Corsi.
Corsi On - On-Ice Shot Differential (goals + saves + missed shots + blocks). This is expressed as a rate stat per 60 minutes.
On-Ice Sh% - Team shooting percentage while a player was on the ice
On-Ice Sv% - Team save percentage while a player was on the ice.
PDO - PDO is the sum of "On-Ice Shooting Percentage" and "On-Ice Save Percentage" while a player was on the ice. It regresses very heavily to the mean in the long-run: a team or player well above 1000 has generally played in good luck and should expect to drop going forward and vice-versa.
Pens Drawn/60 - Individual Penalties Taken per 60 Minutes. Excludes coincidental penalties.
Pens Taken/60 - Individual Penalties Drawn per 60 Minutes. Excludes coincidental penalties.
G/60 – Goals per 60 minutes
A/60 - Assists per 60 minutes
P/60 - Points per 60 minutes
*****
The Games Played slide filter players that have played within the selected range. Players with 10 games minimum are included, otherwise not included.
The Stat to filter top players default is G/60. This is the driving factor of the visualization, using the values in the x, y and z axis to distinguish the top players in this category.
The Top X Players dictates the amount of players to compare. Too many players make the visualization look too cluttered