


The New York Islanders 5-4 overtime win over the New Jersey Devils on a goal by Brad Boyes was the fifth NHL game to end in overtime on a power play goal this season.
This trend is eerily similar to that in 2011-12.
Edmonton has two wins to lead the NHL. Twice the New Jersey Devils were on the losing end of an ill-timed overtime penalty. Both penalties were called on a defenseman (Andy Greene and Henrik Tallinder), while in the other three OT winners, the penalties were by forwards.
To date, there have been 11 OT wins, 45% of the overtime winners had the benefit of a power play.
There were 200 games played by teams (100 match ups) to that point of the schedule, setting a pace of 36 overtime games decided by a power play marker in a 48 game season.
Of note, and in contrast to 2011-12 – expanded below – only one goal was scored by a defenseman, Montreal’s Andrei Markov against the Devils.
This is a staggering record-setting pace, albeit in a very small sample size. Over a full 48 game season, that translates to 36 games and when extrapolated to a full 82 game season that number inflates to 62.
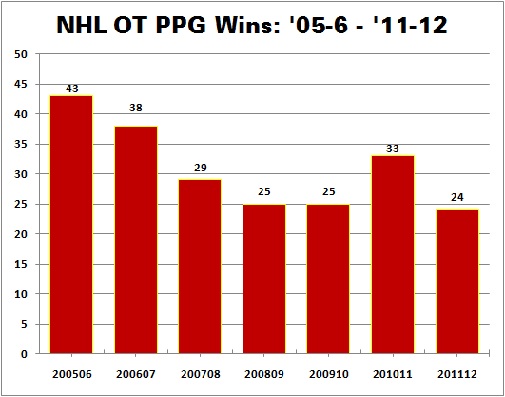
Between lockouts, the most power play overtime winners occurred in the immediate season with 43. This season has similarities with an early run up in OT power play markers.
The yearly breakdown between lockouts is shown below:
In ’11-12, the NHL hit a post-lockout record, 34 days to hit the 10 games mark, almost an entire month ahead of the historical norm between December 3 and Dec 11. The table below indicates the date 10 OT wins occurred. TmGP is the aggregated amount of games played by all teams, and IndGP are games played in matchups.
| Season | TmGP | IndGP |
|---|---|---|
| 05-06 Dec 3 | 792 | 396 |
| 06-07 Dec 6 | 818 | 409 |
| 07-08 Dec 10 | 880 | 440 |
| 08-09 Dec 20 | 970 | 485 |
| 09-10 Dec 12 | 954 | 477 |
| 10-11 Dec 11 | 874 | 437 |
| 11-12 Nov 10 | 442 | 221 |
Then, something strange happened. The calls lessened. Less games were being decided in OT by a power play marker.
It’s not likely the entire league developed new discipline or played a more careful game in the extra frame.
Consider the run up to the 34 day run to 221 games played by November 10:
• 22 games were decided in overtime
• 10 overtime game winners via a power play goal (45% of GP) – evens home/road split (5)
o In the final 2018 games played, 14 more games would be decided with an OT power play marker
• 5 of the first 6 overtime games in '11-12 were decided by a power play goal – the only exception was David Jones OT marker versus Toronto on October 17
• 7 of the first 10 OT PPG were scored by a defenseman (2 by Jack Johnson then still with Los Angeles)
• LA Kings and Washington led the NHL with 2 OT wins
• Both Los Angeles overtime power play game winners were by Jack Johnson and both Capitals game winner by defensemen (Mike Green and Dennis Wideman)
• At Nov 10, 19 penalties had been called in overtime league-wide. There were 52 more overtime power plays for a total of 71 for the season.
The 34 days span was from the beginning of the season, but the least amount of real days since the lockout was a 17 day span between Mar 1, 2007 and March 18, 2007 that featured 10 overtime power play game winners.
A span of 22 days (Mar 16, 2007 to April 7) also produced 10 OT power play markers as well as March 8, 2008 and April 8 - 29 days.
In the first season after the lockout, the final 10 games decided by an overtime goal were over a 23-day span.
2005-06 TO 2011-12
Using the lockouts as bookends, the breakdown consists of two vital components graphed below. Total OT wins (and OT losses) by a power play goal broken down by team and season.
Vancouver and Tampa Bay are the only clubs to have at least one overtime win on the strength of a power play goal for each year after the lockout.
MOST OT WINS BY A POWER PLAY GOAL BY SEASON
| East OT W | ATL | BOS | BUF | CAR | FLA | MTL | NJD | NYI | NYR | OTT | PHI | PIT | TBL | TOR | WSH | Tot |
| 200506 | 2 | 4 | 1 | 4 | 2 | 1 | 1 | 1 | 1 | 1 | 4 | 22 | ||||
| 200607 | 3 | 3 | 2 | 3 | 2 | 1 | 2 | 2 | 1 | 2 | 1 | 1 | 23 | |||
| 200708 | 2 | 2 | 4 | 2 | 2 | 2 | 1 | 1 | 2 | 1 | 19 | |||||
| 200809 | 1 | 2 | 3 | 2 | 1 | 2 | 1 | 1 | 2 | 1 | 16 | |||||
| 200910 | 1 | 2 | 1 | 2 | 3 | 1 | 2 | 12 | ||||||||
| 201011 | 1 | 1 | 1 | 1 | 1 | 3 | 2 | 2 | 3 | 1 | 2 | 18 | ||||
| 201112 | 3 | 1 | 1 | 2 | 2 | 1 | 2 | 2 | 14 | |||||||
| Tot | 10 | 6 | 14 | 9 | 9 | 8 | 9 | 6 | 7 | 4 | 5 | 9 | 10 | 10 | 8 | 124 |
| West OT W | ANA | CBJ | CGY | CHI | COL | DAL | DET | EDM | LAK | MIN | NSH | PHX | SJS | STL | VAN | Tot |
| 200506 | 2 | 1 | 1 | 2 | 1 | 3 | 2 | 1 | 2 | 5 | 1 | 21 | ||||
| 200607 | 2 | 1 | 1 | 2 | 2 | 1 | 1 | 1 | 4 | 15 | ||||||
| 200708 | 1 | 1 | 1 | 1 | 1 | 1 | 1 | 2 | 1 | 10 | ||||||
| 200809 | 1 | 1 | 1 | 2 | 1 | 1 | 1 | 1 | 9 | |||||||
| 200910 | 1 | 1 | 1 | 2 | 1 | 1 | 1 | 1 | 1 | 3 | 13 | |||||
| 201011 | 1 | 1 | 1 | 3 | 1 | 2 | 1 | 1 | 2 | 1 | 1 | 15 | ||||
| 201112 | 1 | 1 | 1 | 2 | 1 | 1 | 1 | 2 | 10 | |||||||
| Tot | 6 | 5 | 2 | 4 | 9 | 4 | 6 | 6 | 6 | 6 | 6 | 7 | 10 | 3 | 13 | 93 |
The New York Rangers are hardest hit here, the only club with a loss in each year between lockouts.
MOST OT LOSSES BY A POWER PLAY GOAL BY SEASON
| East OT L | ATL/WPG | BOS | BUF | CAR | FLA | MTL | NJD | NYI | NYR | OTT | PHI | PIT | TBL | TOR | WSH | Tot |
| 200506 | 1 | 2 | 3 | 4 | 1 | 3 | 1 | 2 | 3 | 1 | 2 | 23 | ||||
| 200607 | 1 | 3 | 5 | 1 | 3 | 1 | 3 | 1 | 1 | 1 | 2 | 22 | ||||
| 200708 | 1 | 1 | 2 | 2 | 1 | 1 | 1 | 1 | 1 | 1 | 3 | 4 | 19 | |||
| 200809 | 2 | 2 | 1 | 2 | 1 | 1 | 1 | 1 | 1 | 12 | ||||||
| 200910 | 1 | 1 | 1 | 2 | 1 | 1 | 1 | 1 | 2 | 3 | 2 | 16 | ||||
| 201011 | 2 | 1 | 2 | 1 | 2 | 1 | 1 | 2 | 1 | 1 | 1 | 15 | ||||
| 201112 | 1 | 1 | 3 | 1 | 1 | 3 | 1 | 1 | 1 | 2 | 15 | |||||
| Tot | 7 | 3 | 7 | 10 | 14 | 10 | 3 | 10 | 9 | 3 | 10 | 8 | 7 | 12 | 8 | 122 |
| West OT L | ANA | CBJ | CGY | CHI | COL | DAL | DET | EDM | LAK | MIN | NSH | PHX | SJS | STL | VAN | Tot |
| 200506 | 2 | 1 | 5 | 3 | 2 | 1 | 1 | 2 | 1 | 2 | 20 | |||||
| 200607 | 3 | 2 | 1 | 2 | 2 | 2 | 3 | 1 | 16 | |||||||
| 200708 | 2 | 2 | 2 | 2 | 2 | 10 | ||||||||||
| 200809 | 3 | 1 | 1 | 3 | 1 | 1 | 1 | 2 | 13 | |||||||
| 200910 | 2 | 1 | 1 | 1 | 2 | 1 | 1 | 9 | ||||||||
| 201011 | 1 | 1 | 2 | 3 | 2 | 2 | 1 | 1 | 1 | 1 | 1 | 2 | 18 | |||
| 201112 | 1 | 2 | 1 | 1 | 1 | 2 | 1 | 9 | ||||||||
| Tot | 8 | 4 | 7 | 9 | 3 | 11 | 6 | 11 | 6 | 4 | 4 | 3 | 4 | 10 | 5 | 95 |
Follow the McKeen's team on Twitter:
@KatsHockey
@mckeenshockey