


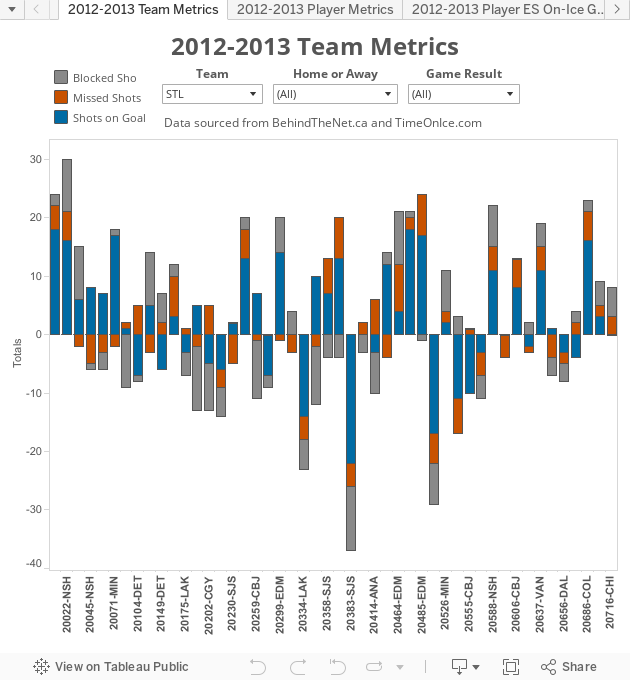
Data compiled from www.behindthenet.ca and http://www.timeonice.com
Robb Tufts is a data visualization professional who has been using Tableau software since 2010. His data visualizations have been featured on Tableau's website as "Viz of the Day" and as winner of the "Evil Viz" contest. He has collaborated with Rob Vollman's Hockey Abstract site and is a regular contributor to St. Louis Game Time. We have included a section for Frequently Asked Questions right below the chart. You can also download the FAQ's here
Follow the McKeen's team on Twitter:
@KatsHockey
@mckeenshockey