


The distance between Sault Ste. Marie and Windsor, Ontario is approximately, 568 kilometers. The Greyhounds begin their lone 3-games-in-3 nights set in 2013-14 starting with Ontario’s southernmost franchise, before moving on to Plymouth and Saginaw in Michigan to complete the set.
This isn’t the only benefit the Hounds enjoy this season. The second encompasses 25% of their schedule with a marked advantage.
Strictly by coincidence, Windsor was one of three teams with one 3-in-3 set in 2012-13, along with the Edmonton Oil Kings and Prince Albert Raiders in the WHL. In 2013-14, the Greyhounds are the only OHL club to have one 3-in-3 set with Lethbridge, Medicine Hat, Moose Jaw and Regina in the WHL sharing the same number.
The distance traversed is less than the furthest expanse for the Greyhounds. For instance, there’s an 800 km distance between Sault Ste. Marie and Ottawa that can be travelled between 8-10 hours and passes through Sudbury and the newest OHL franchise, North Bay Battalion – after they moved from Brampton on the outskirts of the GTA. Traveling into the Toronto area is similar in length – about 700 km – with a travel time of 7-8 hours, where there are five teams within a 2-3 hour drive
THREE GAMES IN THREE NIGHTS
One of the driving attributes of schedules distinguishing the National Hockey League to other North American leagues is that the NHL does not schedule 3-games in 3 night sets. The American Hockey League – a talent feeder league – schedules games over three straight days, usually, if not exclusively, to the weekend Friday-Saturday-Sunday combination.
Member leagues under the CHL umbrella share this same scheduling attribute. Apart, as separate entities, the OHL, WHL and QMJHL vary in their particular characteristics, but share the same philosophy.
The OHL has a higher average number of overall sets per team, hovering around six, with the other leagues at about half of that, counting about three sets per club.
| Average | Min | Max | |
| OHL | |||
| 3-in-3 | 5.9 | 1 | 9 |
| 3-in-3 Rd | 1.35 | 0 | 3 |
| WHL | |||
| 3-in-3 | 2.9 | 0 | 7 |
| 3-in-3 Rd | 1.1 | 0 | 5 |
| QMJHL | |||
| 3-in-3 | 2.8 | 2 | 3 |
| 3-in-3 Rd | 1.7 | 0 | 3 |
The number of sets is scattered in the OHL with member clubs distances making for travel between arenas accommodating for short-ish jaunts during winter weekends. Consider, for instance a Friday night game in Mississauga then Saturday contest in Oshawa and then off to one of Belleville, Peterborough or Kingston only a short drive from General Motors Centre where the Generals suit up. The end result is a mix of 3 games in 3 night set combinations, the end result potentially varying each season.
Stability is available in the QMJHL where parity among clubs amounts to a similar number of 3-in-3 sets, with 2013-14 at three per team, falling in line with the previous season. Travel is slightly more spread out in ‘the Q’ – mimicking similarities to the OHL – yet expansive enough to limit games to consecutive nights and dropping the third game entirely. Less teams (18 teams in the QMJHL) also makes for lessened travel, while the Q starts their season one week earlier than the other two leagues, spreading games slightly further.
The WHL features four teams without any 3-in-3 sets in 2013-14; Victoria, Red Deer, Calgary and the Eastern-most outpost, Brandon, home of the Wheat Kings. The challenge of expanse and long bus rides are slightly diminished in higher density areas closer to the West coast resulting in the Western Conference having a slight higher concentration of 3-in-3 sets.
For instance, the distance between bookend franchises in the Western Hockey League is a 21 hour bus ride, maybe more.
The QMJHL have similar effects with a 20 hour span between Cape Breton and Rouyn-Noranda.
Let’s look back before moving ahead.
2012-14 SEASON RECAP
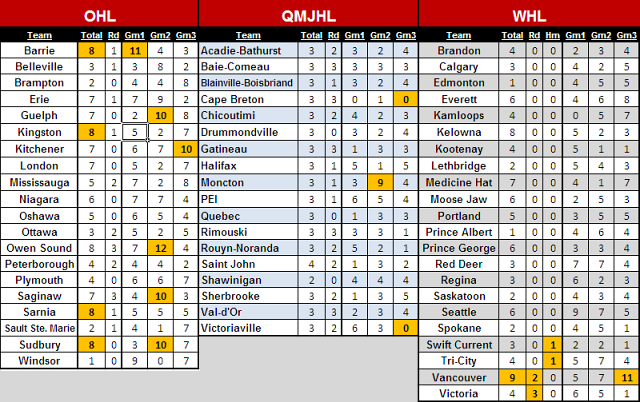
Explanations of the headings are as follows.
The TOTAL column denotes the number of 3-in-3 sets
The Rd Column signifies the number of sets all played strictly on the road. The WHL in this case is very different from ’12-13 to ’13-14 as we shall see. Vancouver and Victoria were the only two clubs with sets strictly on the road. That changes this season.
The Gm1 through Gm3 columns designate the amount of games in which the team lined up on the left faced an opponent playing in the associated game number, 1, 2, or 3 during a 3-in-3 set.
For example, Vancouver led the entire CHL dressing for 11 games where the opponent was playing their third game in three nights. The Kitchener Rangers played 10 such contests.
2013-14 SEASON – RELEASE THE HOUNDS!
I added two additional columns for the ’13-14 edition.
With all the attention I’ve devoted to teams playing rested/tired in the NHL I couldn’t resist figuring out the CHL equivalent. I defined Rested and Tired in a post here , with the definitions appearing below.
- Rested – a team that has not played the previous night facing a team in the second game of a back-to-back set on consecutive nights.
- Tired – a team playing its second game on consecutive nights versus a team that is rested and has not played the previous night.
Enough prelude, on to the data.
We start with the OHL with notes below the table.
| OHL | |||||||
| Team | 3-in-3 | 3-in-3 Rd | Gm1 | Gm2 | Gm3 | Tired | Rested |
| Barrie | 9 | 1 | 4 | 5 | 3 | 20 | 10 |
| Belleville | 5 | 2 | 6 | 15 | 4 | 14 | 14 |
| Erie | 5 | 2 | 6 | 5 | 3 | 16 | 12 |
| Guelph | 7 | 1 | 6 | 10 | 3 | 12 | 14 |
| Kingston | 6 | 2 | 5 | 3 | 9 | 13 | 19 |
| Kitchener | 6 | 0 | 6 | 7 | 4 | 6 | 10 |
| London | 8 | 3 | 7 | 6 | 5 | 10 | 7 |
| Mississauga | 6 | 2 | 5 | 5 | 7 | 6 | 12 |
| Niagara | 8 | 1 | 9 | 3 | 1 | 18 | 10 |
| North Bay | 2 | 2 | 10 | 3 | 6 | 14 | 14 |
| Oshawa | 6 | 0 | 6 | 3 | 10 | 12 | 17 |
| Ottawa | 4 | 2 | 8 | 2 | 7 | 10 | 13 |
| Owen Sound | 6 | 0 | 9 | 7 | 5 | 10 | 11 |
| Peterborough | 6 | 1 | 2 | 3 | 3 | 17 | 11 |
| Plymouth | 6 | 1 | 3 | 8 | 7 | 10 | 7 |
| Saginaw | 3 | 1 | 4 | 12 | 7 | 5 | 10 |
| Sarnia | 9 | 1 | 3 | 8 | 3 | 17 | 9 |
| Sault Ste. Marie | 1 | 1 | 5 | 0 | 16 | 10 | 12 |
| Sudbury | 9 | 2 | 2 | 12 | 3 | 15 | 16 |
| Windsor | 6 | 2 | 12 | 1 | 12 | 9 | 16 |
| Average | 6 | 1 | 6 | 6 | 6 | 12 | 12 |
| Min | 1 | 0 | 2 | 0 | 1 | 5 | 7 |
| Max | 9 | 3 | 12 | 15 | 16 | 20 | 19 |
The clear takeaway here, is not only the one 3-in-3 set, but the 16 games the Greyhounds face an opponent playing their third game in three nights. In a 68 game schedule, that amounts to 25% of the total schedule. Windsor lags by four games, with Oshawa rounding out the double digits.
Scouts often emphasize the Friday games versus a Sunday game and comparison of scouting views. This little tidbit is helpful in this regard. Watching players on a Friday night is very different from a Sunday game after the weekend grind.
Sudbury, Sarnia and Barrie share the lead with nine (9) sets.
Barrie leads the OHL playing in 20 games as a tired team, balanced by half that amount as a rested team. Kingston leads the league with 19 games as a rested team.
Let’s move on to the more stable QMJHL.
| QMJHL | |||||||
| Team | 3-in-3 | 3-in-3 Rd | Gm1 | Gm2 | Gm3 | Tired | Rested |
| Acadie-Bathurst | 3 | 2 | 7 | 1 | 4 | 7 | 10 |
| Baie-Comeau | 3 | 3 | 2 | 2 | 4 | 6 | 8 |
| Blainville-Boisbriand | 3 | 2 | 3 | 3 | 7 | 6 | 10 |
| Cape Breton | 2 | 2 | 1 | 2 | 0 | 9 | 4 |
| Charlottetown | 3 | 1 | 0 | 7 | 2 | 5 | 12 |
| Chicoutimi | 3 | 3 | 3 | 2 | 1 | 9 | 10 |
| Drummondville | 3 | 1 | 5 | 2 | 6 | 11 | 12 |
| Gatineau | 3 | 1 | 2 | 0 | 4 | 7 | 6 |
| Halifax | 3 | 2 | 1 | 1 | 2 | 13 | 10 |
| Moncton | 2 | 1 | 2 | 1 | 4 | 9 | 7 |
| Quebec | 3 | 1 | 3 | 3 | 1 | 11 | 8 |
| Rimouski | 2 | 2 | 4 | 2 | 1 | 7 | 3 |
| Rouyn-Noranda | 3 | 3 | 1 | 1 | 1 | 8 | 8 |
| Saint John | 3 | 1 | 3 | 5 | 4 | 8 | 10 |
| Shawinigan | 3 | 1 | 2 | 5 | 3 | 9 | 10 |
| Sherbrooke | 3 | 1 | 7 | 7 | 3 | 3 | 6 |
| Val-d'Or | 3 | 3 | 1 | 1 | 1 | 10 | 6 |
| Victoriaville | 3 | 0 | 4 | 6 | 3 | 10 | 8 |
| Average | 3 | 2 | 3 | 3 | 3 | 8 | 8 |
| Min | 2 | 0 | 0 | 0 | 0 | 3 | 3 |
| Max | 3 | 3 | 7 | 7 | 7 | 13 | 12 |
The entire league is fairly vanilla across all categories. The average number of 3-in-3 sets is a consistent three (3), with all but Victoriaville playing at least one set with every game on the road.
Blainville-Boisbriand leads the ‘Q’ with seven (7) games against a team playing their third game in three nights. Unsurprisingly, CapeBreton is the only Quebec team without an instance against a team on their third game in three nights (Saskatoon is the only other team in the CHL that is blanked.)
Halifax plays the most games as a tired team, with the Charlottetown Islanders leading the rested category with 12.
Moving over to the WHL, we see a difference from ’12-13 both in the number of teams without a 3-in-3 set as well as the increase in the number of sets strictly on the road, a little different from the Vancouver/Victoria combination of a year ago.
| WHL | |||||||
| Team | 3-in-3 | 3-in-3 Rd | Gm1 | Gm2 | Gm3 | Tired | Rested |
| Brandon | 0 | 0 | 4 | 1 | 2 | 7 | 10 |
| Calgary | 0 | 0 | 4 | 3 | 4 | 5 | 9 |
| Edmonton | 3 | 2 | 4 | 3 | 3 | 10 | 10 |
| Everett | 6 | 0 | 4 | 6 | 4 | 6 | 8 |
| Kamloops | 3 | 2 | 1 | 4 | 4 | 5 | 8 |
| Kelowna | 4 | 2 | 5 | 2 | 1 | 9 | 6 |
| Kootenay | 2 | 0 | 3 | 5 | 5 | 7 | 7 |
| Lethbridge | 1 | 0 | 2 | 5 | 2 | 4 | 11 |
| Medicine Hat | 1 | 0 | 3 | 1 | 1 | 13 | 9 |
| Moose Jaw | 1 | 1 | 0 | 2 | 2 | 11 | 8 |
| Portland | 5 | 2 | 9 | 2 | 5 | 9 | 7 |
| Prince Albert | 2 | 1 | 1 | 1 | 2 | 8 | 8 |
| Prince George | 5 | 5 | 0 | 1 | 3 | 7 | 2 |
| Red Deer | 0 | 0 | 3 | 3 | 2 | 11 | 8 |
| Regina | 1 | 0 | 2 | 2 | 1 | 6 | 9 |
| Saskatoon | 5 | 2 | 4 | 1 | 0 | 15 | 6 |
| Seattle | 7 | 2 | 5 | 6 | 5 | 5 | 3 |
| Spokane | 5 | 3 | 2 | 3 | 4 | 5 | 8 |
| Swift Current | 4 | 1 | 0 | 0 | 2 | 5 | 9 |
| Tri-City | 3 | 1 | 3 | 5 | 3 | 6 | 4 |
| Vancouver | 5 | 0 | 2 | 3 | 6 | 6 | 10 |
| Victoria | 0 | 0 | 2 | 4 | 2 | 3 | 3 |
| Average | 3 | 1 | 3 | 3 | 3 | 7 | 7 |
| Min | 0 | 0 | 0 | 0 | 0 | 3 | 2 |
| Max | 7 | 5 | 9 | 6 | 6 | 15 | 11 |
Already having covered the zero set teams, the Western Conference Seattle Thunderbirds lead the WHL, with Everett a close second and Portland, Vancouver, Spokane and Saskatoon rounding out third overall.
Prince George is the only CHL team that plays all it’s 3-in-3 sets on the road. Scheduling will bite them in ’13-14 as they face a team on their third game in three nights three times, and end up as a tired team seven (7) times in a not-so-lucky turn of events. All that while playing a WHL low two games as a rested team.
Strength of schedule on a macro level may not have a significant effect, however, taking it to the micro level, counting the little intricacies associated to each club paints a bit of a different picture.
*********************************
Follow the McKeen's team on Twitter:
@KatsHockey
@mckeenshockey