


I should have posted this earlier in the season instead of after 20 games (or Q1 as I’ve been calling the four NHL quarters). The weekly breakdown by team (Starting from Monday to Sunday) is below.
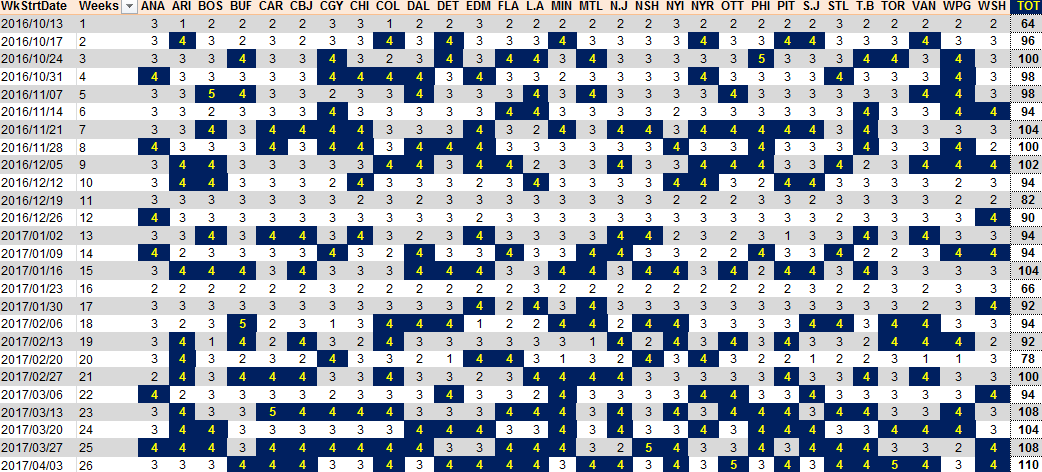
With talk of a compressed schedule and a bye week, this is how the NHL plays out over the season, with a slew of teams playing through four-game weeks to close off the final three weeks of the NHL season.
I would normally present a table breaking down the rested/tired splits for NHL teams for 2016-17.
| Team | B2B | Tired | Rested | % B2B Tired | DIVISION |
| ANA | 14 | 11 | 19 | 78.57 | PACIFIC |
| BOS | 14 | 11 | 6 | 78.57 | ATLANTIC |
| BUF | 19 | 13 | 6 | 68.42 | ATLANTIC |
| CGY | 11 | 10 | 14 | 90.91 | PACIFIC |
| CAR | 16 | 6 | 15 | 37.50 | METROPOLITAN |
| CHI | 14 | 8 | 12 | 57.14 | CENTRAL |
| COL | 11 | 5 | 12 | 45.45 | CENTRAL |
| CBJ | 19 | 10 | 7 | 52.63 | METROPOLITAN |
| DAL | 10 | 7 | 9 | 70.00 | CENTRAL |
| DET | 16 | 13 | 11 | 81.25 | ATLANTIC |
| EDM | 10 | 8 | 19 | 80.00 | PACIFIC |
| FLA | 15 | 10 | 7 | 66.67 | ATLANTIC |
| L.A | 16 | 13 | 12 | 81.25 | PACIFIC |
| MIN | 14 | 14 | 10 | 100.00 | CENTRAL |
| MTL | 15 | 9 | 9 | 60.00 | ATLANTIC |
| NSH | 13 | 10 | 7 | 76.92 | CENTRAL |
| N.J | 18 | 8 | 10 | 44.44 | METROPOLITAN |
| NYI | 16 | 7 | 13 | 43.75 | METROPOLITAN |
| NYR | 16 | 13 | 11 | 81.25 | METROPOLITAN |
| OTT | 13 | 7 | 11 | 53.85 | ATLANTIC |
| PHI | 18 | 13 | 7 | 72.22 | METROPOLITAN |
| ARI | 13 | 11 | 12 | 84.62 | PACIFIC |
| PIT | 15 | 12 | 15 | 80.00 | METROPOLITAN |
| S.J | 16 | 14 | 8 | 87.50 | PACIFIC |
| STL | 12 | 8 | 8 | 66.67 | CENTRAL |
| T.B | 16 | 12 | 13 | 75.00 | ATLANTIC |
| TOR | 18 | 14 | 8 | 77.78 | ATLANTIC |
| VAN | 16 | 13 | 6 | 81.25 | PACIFIC |
| WSH | 16 | 12 | 9 | 75.00 | METROPOLITAN |
| WPG | 14 | 10 | 6 | 71.43 | CENTRAL |
With the emergence of superior visualizations by Micah Blake McCurdy on hockeyviz.com, he offered the viz for these teams here that offers a more visually aesthetic alternative.
I urge you to go check out poke around the site – I used it extensively for the line combinations while writing the Yearbook. If you feel there’s value, please consider throwing some resources into the patreon to keep the site up and running.
Schedling Advantages/Disadvantages
In 2016-17, the Anaheim Ducks turn the tables on the Los Angeles Kings, hosting a bunch of games as a rested team against a tired team that flowed through LA first for Game 1.
For the better part of two seasons, the Kings have held a decidedly expansive advantage over teams traveling through southern California. I’ve gone into this in much more detail in this piece offering the perennial Stanley Cup contenders a scheduling advantage – that they also bungled to miss the playoffs in 2014-15 as outlined in that link.
This season, the Ducks have the advantage by a net four games – with eight teams traveling through Anaheim first before playing the rested Kings in Game 2.
League wide, this is how the advantage/disadvantage looks. Teams with the disadvantage (playing Game 1 against a team that will be playing a rested team in Game 2) appear in the first column, while teams with the advantage appear at the top.
To read the chart, find the team in the first column (the team playing Game 1) and line it up with the team across the top (rested team playing Game 2). The Kings example shows a 12 game lopsided balance here over the Ducks, and two times over the Coyotes – with some singles usually denoted as road contests through the East.
Toronto has a disadvantage of four games where teams play the rested Montreal Canadiens on the second game of a B2B.
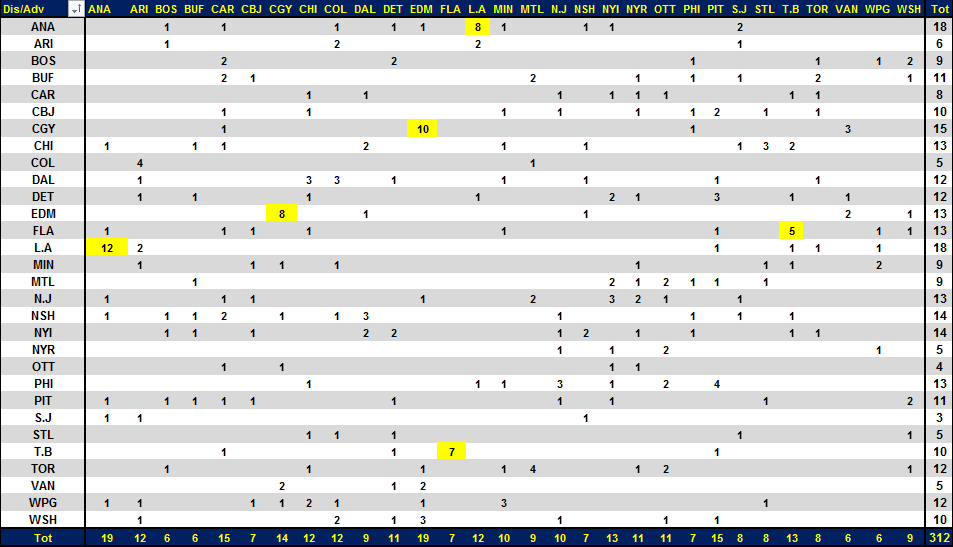
Calgary also has a two game advantage over the Oilers in an area that experiences lots of teams traveling through both cities over two nights – sometimes playing through a rested team in Game 2.
The other pocket is in Florida where Tampa Bay holds the slight advantage in ’16-17.
Game One
When I do my rested/tired investigation on the NHL schedule, the focus usually ends up entirely on the team playing in the back-to-back situation. The focus has really been entirely on the second game of the back-to-back, focusing on the effect that it had on the tired team while pinpointing the advantage attained by the rested team.
What about the first game? What has happened in the Game 1 of those back to backs? Is there any impact or a double whammy here that could end up costly where divisional currency can potentially cost a team a playoff spot.
Clearly the second game opponent has an advantage as a rested team, but how much of the disadvantages are really being the game one opponent?
Most back-to-back situations involve teams traveling through host cities, increasing the likelihood of lining up against two teams within the same division, offering a distinct advantage to that second team above and beyond the rested advantage, the game one team clearly lacks. Via winning percentage, we see a distinct advantage in being the second game.
To isolate the effect of being a game one team, I went back from the first lockout in 2005-06 to 2015-16 (while I hate to take away data, I didn't want to use the lockout shortened season because all teams played within their conference until the Stanley Cup finals) and compiled all the games that involve the rested and tired team in both games one and two.
Turns out that teams playing game one generally had a 50-50 chance of outright winning – that’s buoyed by a percentage of extra time points), while a rested team clearly has the advantage posting an overall winning percentage over .600. While that doesn't seem to be much of a difference, with all the focus on divisional play in the margins of error for making the playoffs, the advantage of a swing through the Anaheim-LA combination, that exists in Florida, Alberta, somewhat in Ontario, and through the New York teams, can have potential playoff ramifications.
Overall the effect is still about being the team playing a rested team and again to sequence of back-to-back.
The Division columns indicate that both teams in Games 1 & 2 belong to the same division – example, Anaheim and Los Angeles or Florida/Tampa Bay.
| TOTAL | OVERALL | DIVISION | NON-DIV | |||
| SEASON | Dis Game 1 Win% | Adv Game 2 Win% | Dis Game 1 Win% | Adv Game 2 Win% | Dis Game 1 Win% | Adv Game 2 Win% |
| 200506 | 0.487 | 0.652 | 0.497 | 0.624 | 0.473 | 0.688 |
| 200607 | 0.548 | 0.599 | 0.563 | 0.604 | 0.531 | 0.594 |
| 200708 | 0.489 | 0.619 | 0.497 | 0.623 | 0.477 | 0.614 |
| 200809 | 0.493 | 0.628 | 0.493 | 0.621 | 0.493 | 0.635 |
| 200910 | 0.481 | 0.576 | 0.500 | 0.569 | 0.462 | 0.583 |
| 201011 | 0.512 | 0.593 | 0.517 | 0.575 | 0.507 | 0.612 |
| 201112 | 0.500 | 0.645 | 0.522 | 0.701 | 0.479 | 0.591 |
| 201314 | 0.523 | 0.594 | 0.550 | 0.617 | 0.492 | 0.568 |
| 201415 | 0.489 | 0.642 | 0.496 | 0.642 | 0.481 | 0.642 |
| 201516 | 0.497 | 0.607 | 0.510 | 0.613 | 0.482 | 0.601 |
| W% Total | 0.502 | 0.616 | 0.514 | 0.619 | 0.488 | 0.612 |
It’s a little odd to see the drop off in games where the two teams involved in the back-to-back are not within the same division. The difference between a .514 and .488 win percentage is drastic over the sample used here with almost 10 years’ worth of games to analyze.
Game 2 teams are fairly consistent generating a minimum .612 winning percentage beating up a tired team.
I went through the shot differentials for these back to back sets in greater detail here. I’ve recreated the table here for teams playing back to back for reference.
| Game Type | Games | Wins | Win% |
| Total GP | 17220 | 8607 | 0.558 |
| Non B2B GP | 14168 | 7222 | 0.569 |
| B2B both teams | 794 | 397 | 0.552 |
| Rested B2B | 2258 | 1270 | 0.596 |
| Tired B2B | 2258 | 988 | 0.495 |
************************
Follow the McKeen's team on Twitter: