


OKC Logo via: Copper 'n Blue
Over at Leafs Nation, I did a breakdown of the American Hockey League Toronto Marlies, something I like to call breaking boxcars, so named due to the extended nature of the statistical breakdowns available in the typical boxcar.
I took the game sheets and parsed the data to come up with another layer of context to the existing underlying numbers. Goals scored were broken down by period, along with when those goals were scored, eg tied game, up one goal, or down one goal, among other categories. Some of the most revealing numbers were based on the on ice goals for and against, especially with the firepower available on the Oklahoma City Barons.
An exciting squad based on the sheer level of NHL talent was the AHL affiliate to the Edmonton Oilers. were a natural selection for breaking boxcars.
The Toronto Marlies post is available HERE with an updated version to be posted on Friday Jan. 25.
A quick note on goals gathered in this post.
The AHL site had the Barons at 122 goals scored (41 power play goals) after 40 games played while these numbers indicate 120 goals scored. The discrepancy in the standings lies in two additional goals attributed to shootout wins.
Similarly, goals against stood at 124 (38 power play goals against) with three additional added via shootout losses for 127 total. This post focuses on the 124 goals against, not the 127 as per the standings.
Also of note is that Oklahoma City played an additional game since the initial data gathering and shows 41 games played totals, a 5-4 shootout loss to the Grand Rapids Griffins.)
The first breakdown is one for the players. Space limitations don’t allow for proper presentation, so the data is here in this GOOGLE DOC. This is a breakdown of assists, broken down by first and second assists on the Barons goal scorers.
Jordan Eberle scored 25 goals to lead the Barons – with a 23.6% shooting percentage – but rookie Justin Schultz amplified his legendary entry into the pro by carving up defenses, scoring goals and setting up scoring chances with veteran poise and flashes of offensive brilliance. Schultz combined with Eberle on 10 goals, eight primary assists, two secondary.
Schultz scored 18 goals, with nine assists registered by Eberle, seven as primary, two as secondary.
Taylor Hall had five primary assists, all at even strength, on Eberle goals, adding three more secondary assists. I took a snippet of the google doc shown below to show how the goals/assists relation breaks down by even strength or power play.
Using Jordan Eberle as an example, all eight of Justin Schultz primary assists on Eberle’s goals were evenly split among even-strength and on the power play. Taylor Hall’s five primary assists were all at even strength.
| Players | M. Arcobello | T. Hartikainen | J. Schultz | R. Nugent-Hopkins | M. Marincin | J. Eberle | T. Hall | A. Lander |
|---|---|---|---|---|---|---|---|---|
| J. Eberle | 3 | 2 | 8 | 2 | 5 | |||
| PP | 1 | 2 | 4 | 1 | ||||
| ES | 2 | 4 | 1 | 5 | ||||
| J. Schultz | 2 | 1 | 1 | 7 | 1 | 1 | ||
| PP | 1 | 1 | 3 | 1 | ||||
| ES | 1 | 1 | 4 | 1 | ||||
| R. Nugent-Hopkins | 1 | 3 | 4 | |||||
| EN | 1 | |||||||
| PP | 3 | |||||||
| ES | 1 | 3 | ||||||
| T. Hartikainen | 1 | 2 | 2 | 1 | 1 | |||
| PP | 1 | 2 | 1 | |||||
| ES | 1 | 1 | 1 | |||||
| M. Arcobello | 1 | 1 | 2 | 1 | ||||
| ES | 1 | 1 | 2 | 1 | ||||
| M. Paajarvi | 1 | 1 | 1 | |||||
| PP | 1 | |||||||
| ES | 1 | 1 |
Goals By Period
A dozen of Eberle’s 25 goals were scored in the first period, five were game opening goals.
The breakdown of Barons goals scored by period also reveals Ryan Nugent-Hopkins scoring five of his seven goals in the third period, one each when the score ranged from the Barons down two goals, to the Barons up two goals – a game circumstance that will be expanded on below.
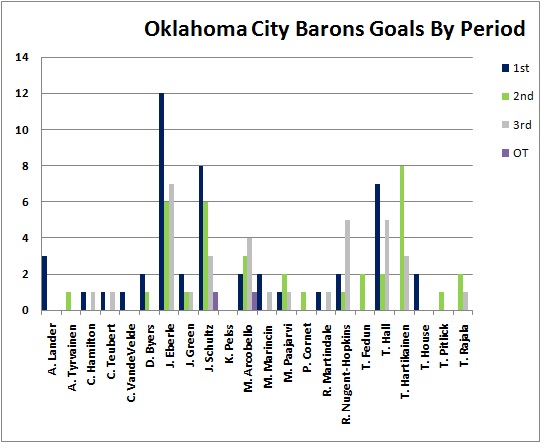
It’s not enough to know what period a player’s goals were scored. Of the seven third period goals scored by Jordan Eberle, two were into an empty net. Both those goals count as 40% of the five goals scored with the Barons up one goal.
Looking at the game situation when players scored adds just another further layer of context. Justin Schultz score 11 goals when the Barons were down two goals, down one, or tied, however is the runaway leader scoring four times with the Barons up by two goals. One of those was an empty net marker, with the goalie pulled.
The chart below indicates how close scores have been relatively for Oklahoma City as the big scorers, Eberle, Hall, Nugent-Hopkins and Schultz scored the majority of their markers in close games, with the score conditions ranging from the Barons down two goals to the Barons being up one – mainly by Eberle’s five markers.
Even hard working and multi-faceted Teemu Hartikainen has three goals split evenly in this range.
Oklahoma City scored 31 goals when down by two, a high amongst categories.
| Players | -4 | -3 | -2 | -1 | T | 1 | 2 | 3 | 4 | -5 | Total |
| M. Arcobello | 2 | 5 | 1 | 1 | 1 | 10 | |||||
| J. Green | 2 | 1 | 1 | 4 | |||||||
| M. Marincin | 2 | 1 | 3 | ||||||||
| J. Schultz | 2 | 1 | 3 | 4 | 4 | 4 | 18 | ||||
| T. Hartikainen | 1 | 3 | 3 | 3 | 1 | 11 | |||||
| J. Eberle | 2 | 4 | 5 | 6 | 2 | 5 | 1 | 25 | |||
| C. Hamilton | 1 | 1 | 2 | ||||||||
| M. Paajarvi | 1 | 1 | 1 | 1 | 4 | ||||||
| R. Nugent-Hopkins | 3 | 2 | 1 | 1 | 1 | 8 | |||||
| T. House | 1 | 1 | 2 | ||||||||
| D. Byers | 2 | 1 | 3 | ||||||||
| A. Tyrvainen | 1 | 1 | |||||||||
| T. Hall | 3 | 3 | 1 | 4 | 2 | 1 | 14 | ||||
| T. Fedun | 1 | 1 | 2 | ||||||||
| T. Rajala | 1 | 1 | 1 | 3 | |||||||
| C. Teubert | 1 | 1 | 2 | ||||||||
| A. Lander | 2 | 1 | 3 | ||||||||
| C. VandeVelde | 1 | 1 | |||||||||
| T. Pitlick | 1 | 1 | |||||||||
| P. Cornet | 1 | 1 | |||||||||
| R. Martindale | 2 | 2 | |||||||||
| Total | 5 | 12 | 31 | 25 | 20 | 13 | 8 | 3 | 2 | 1 | 120 |
On Ice Goals For and Against
Moving on from game situations we get into on ice performance. It’s a shame the AHL doesn’t make time on ice available for players. Below is the breakdown by player for each time they were on the ice for each goals scored overall and by special teams, power play and shorthanded.
Without time on ice statistics to make more accurate conclusions by minutes rather than events, this is just the first step to identify patterns of players on ice performance.
Some conclusions can be drawn, however, with comparisons across teammates and then across other teams.
For instance, Mike Kostka of the Toronto Marlies was on the ice for 60 goals scored by the Marlies, who had scored 127 goals in that span. Kostka was on the ice for 47% of the Toronto Marlies overall goals scored. I though that was an impressive number until Justin Schultz breakdown trumped that.
Schultz was on the ice for 81 goals scored, out of the 120 scored by the Barons, Schultz was on the ice for a whopping 67.5% of the team’s goals. I haven’t broken down the entire league, but that is a significant amount of goals to be on the ice for as a rookie who had not played a professional hockey game prior to the 2012-13 season.
Breaking it down even further, he was on the ice for 36 power play goals. The Barons had a power play percentage of 24% based on 41 goals in 170 opportunities. Schultz was on the ice for 87% of the Barons power play goals.
The 51 goals against while he was on the ice, represents 40% of the Barons goals against.
Haritkainen (33 - 80.5%) and Eberle (34 - 82.9%) were the only other Baron players above the 30 goals for plateau with the man advantage. Eberle was on the ice for 68 total goals, meaning half his on-ice goals for were accounted on the power play. He accounted for 22 power play points, including eight goals.
Schultz scored 25 power play points, (7-18-25) and Hartikainen (5-8-13).
Ryan Nugent-Hopkins dressed for 19 contests and was on the ice for 32 goals scored, with 12 power play points (3-9-12) to compliment his being on the ice for 16 power play goals scored – half of the 32 in total.
Drawing conclusions is difficult due to the incomplete nature of shots on goal and ice time.
| Player | GF | PPGF | SHF | GA | PPGA | SHA |
| Schultz | 81 | 36 | 2 | 51 | 11 | 0 |
| Eberle | 68 | 34 | 0 | 24 | 0 | 4 |
| Hartikainen | 55 | 33 | 0 | 26 | 0 | 4 |
| Hall | 46 | 24 | 0 | 22 | 0 | 2 |
| Arcobello | 45 | 22 | 0 | 33 | 2 | 1 |
| Marincin | 41 | 4 | 1 | 31 | 2 | 0 |
| Cheechoo | 32 | 16 | 0 | 10 | 0 | 2 |
| Nugent-Hopkins | 32 | 16 | 0 | 10 | 0 | 2 |
| Paajarvi | 29 | 12 | 1 | 33 | 7 | 1 |
| Fedun | 24 | 5 | 0 | 33 | 7 | 1 |
| Lander | 22 | 5 | 0 | 30 | 1 | 1 |
| VandeVelde | 14 | 0 | 2 | 36 | 17 | 0 |
| Byers | 13 | 1 | 2 | 24 | 10 | 0 |
| Plante | 13 | 0 | 1 | 29 | 9 | 0 |
| Teubert | 13 | 1 | 1 | 27 | 10 | 0 |
| Deck | 12 | 0 | 0 | 23 | 2 | 0 |
| Green | 12 | 4 | 0 | 17 | 1 | 0 |
| Hamilton | 11 | 1 | 1 | 25 | 4 | 0 |
| Pitlick | 11 | 3 | 0 | 17 | 0 | 1 |
| Henry | 10 | 1 | 1 | 18 | 6 | 0 |
| Martindale | 9 | 1 | 0 | 5 | 0 | 1 |
| House | 7 | 0 | 0 | 24 | 9 | 0 |
| Rajala | 5 | 0 | 0 | 5 | 0 | 0 |
| Pelss | 4 | 0 | 0 | 2 | 0 | 0 |
| Ringwald | 4 | 0 | 0 | 8 | 2 | 0 |
| Cornet | 3 | 2 | 0 | 4 | 0 | 0 |
| Tyrvainen | 3 | 0 | 0 | 2 | 0 | 0 |
| Hotham | 2 | 0 | 0 | 1 | 0 | 0 |
| Lafranchise | 2 | 0 | 0 | 13 | 5 | 0 |
| Zahn | 2 | 0 | 0 | 13 | 5 | 0 |
| Abney | 1 | 0 | 0 | 2 | 0 | 0 |
| Davidson | 1 | 0 | 0 | 3 | 2 | 0 |
| Lizon | 1 | 0 | 0 | 2 | 0 | 0 |
| Hunter | 0 | 0 | 0 | 1 | 0 | 0 |
I will go deeper into AHL teams scoring over the course of the next couple of month, perhaps not as extensive with the Barons, but they certainly were an exciting team to watch to open the season. As much firepower that they had, the defensive game wasn't always apparent and it made for quite dramatic hockey.
Tune in for more Breaking Boxcars.
Follow the McKeen's team on Twitter:
@KatsHockey
@mckeenshockey