For the Toronto Maple Leafs charts:
For the Minnesota Wild charts:
These are the preliminary charts I gather for each team before getting into each individual player (and before any video). These are starting points, not end results. Analysis that these jump off into will be within the pages of the Yearbook.
This doesn't happen without the sites for this data:
War On Ice Hockey Analysis and Behind The Net
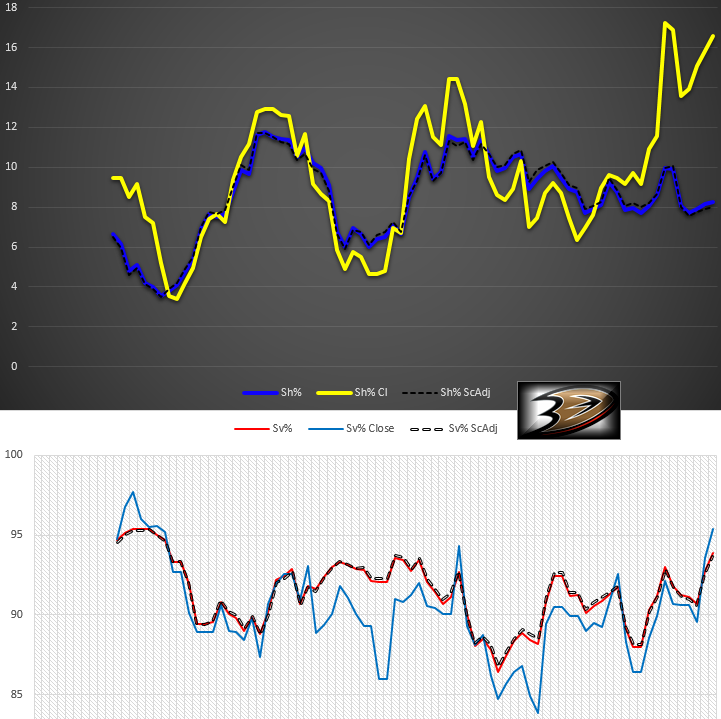
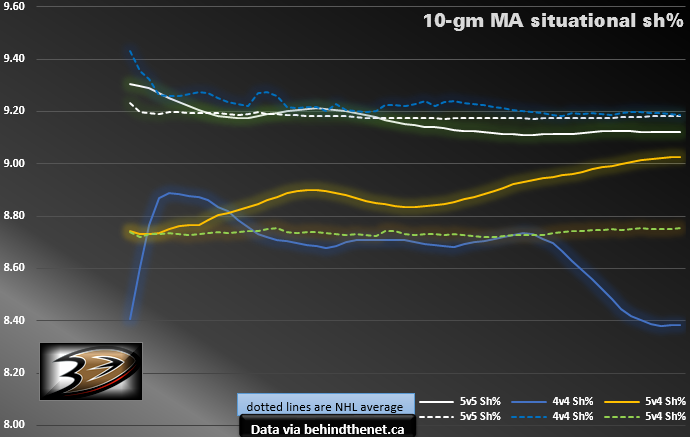
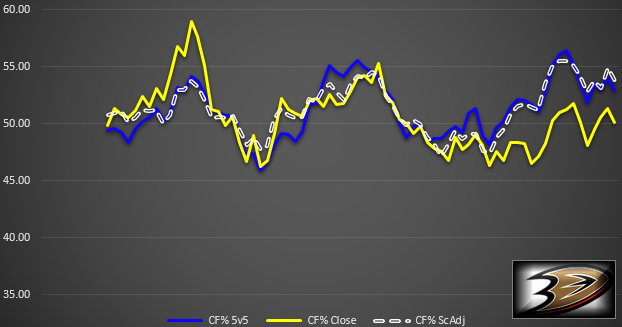
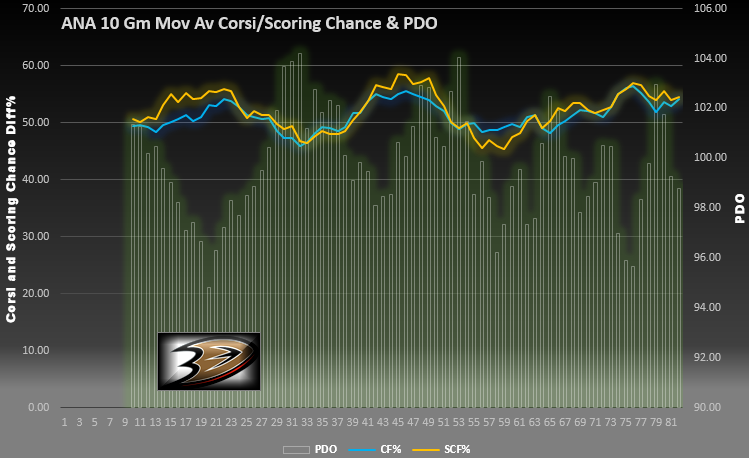
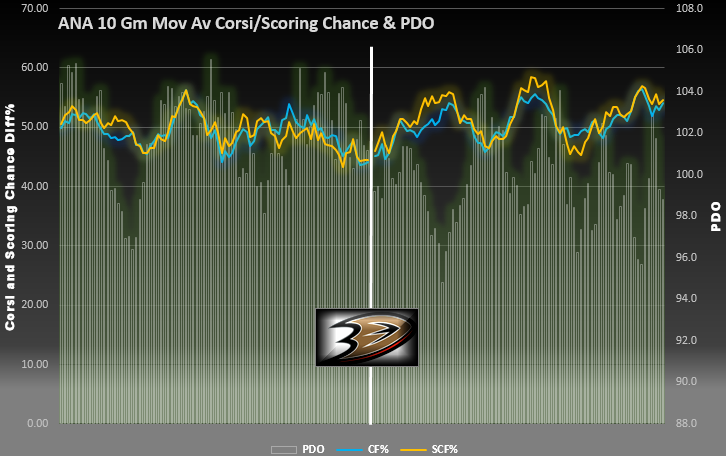
Lets start with some PDO components.
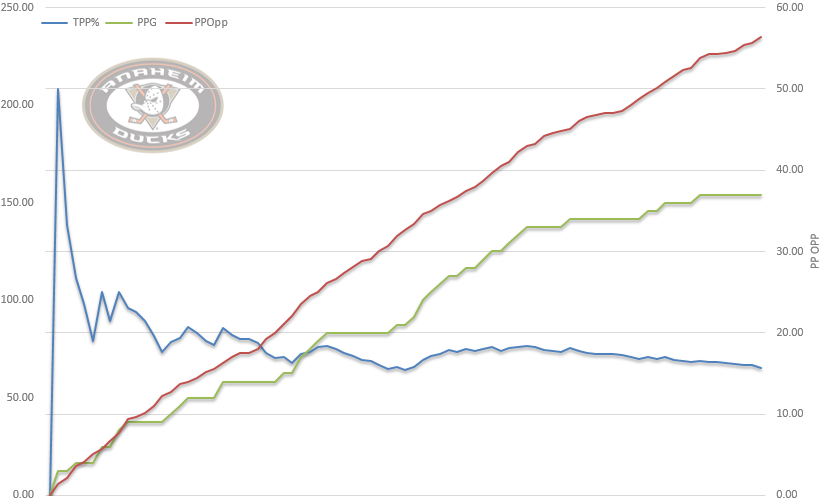
Corey Perry recorded his final power play point of the season on Jan 30, so I split the Ducks season into two parts, pre- and post-Jan 30.
The results.
PRE:
50 GP - 29 goals – 163 opportunities - 17.8% efficiency
0.58 power play goals per game on 3.26 opportunities.
POST
32 GP – 8 goals – 74 opportunities – 10.8% efficiency
0.25 power play goals per game on 2.3 opportunities
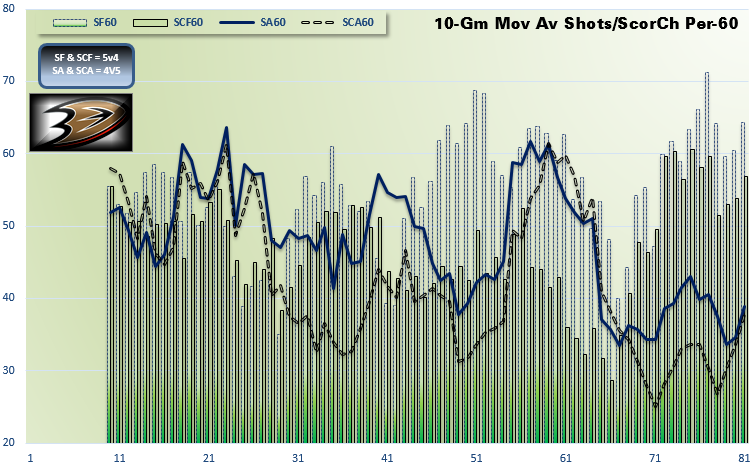
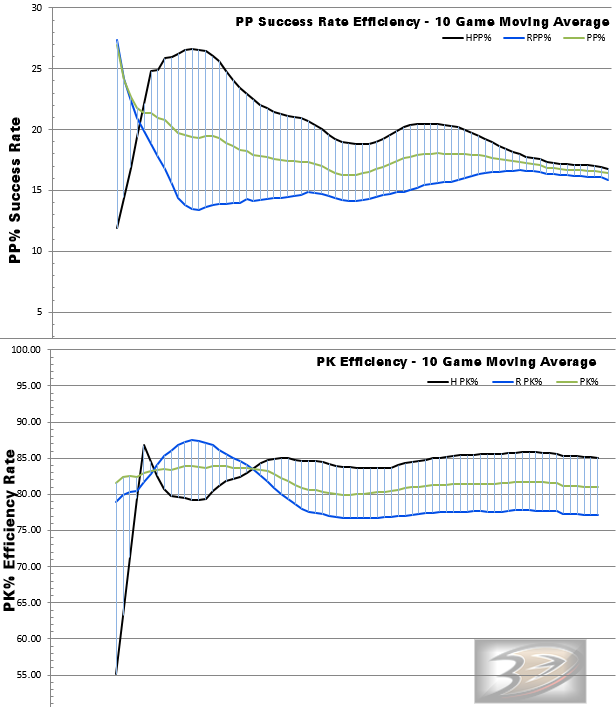
These power play charts below accompany that trend.
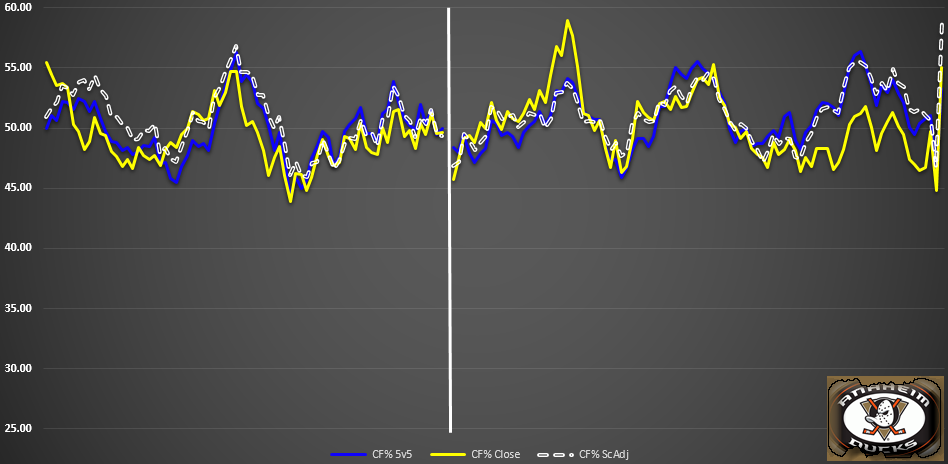
Situational Corsi For percentage 10-game moving average for 1 year and then 2 years below that.
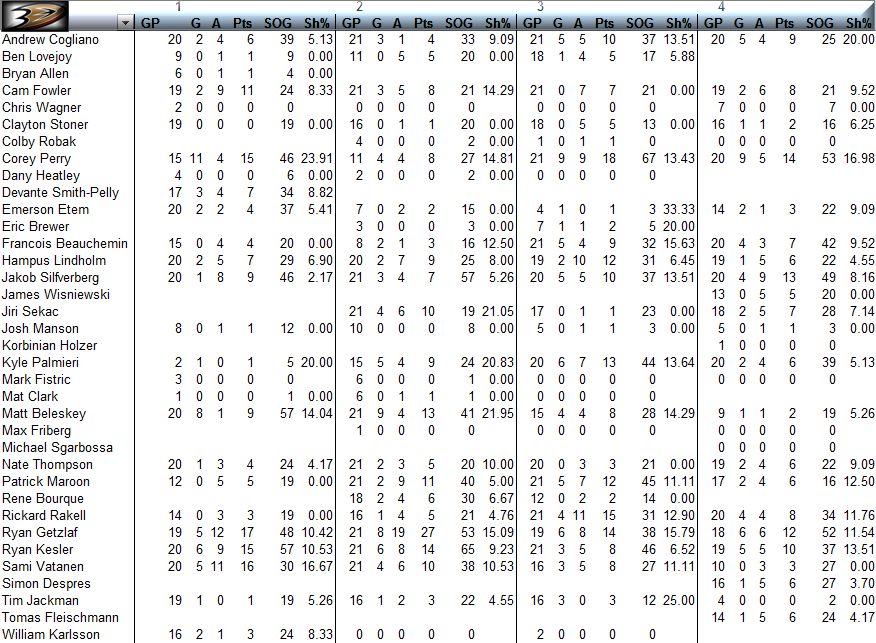
The below chart is a quarterly breakdown of points by players.
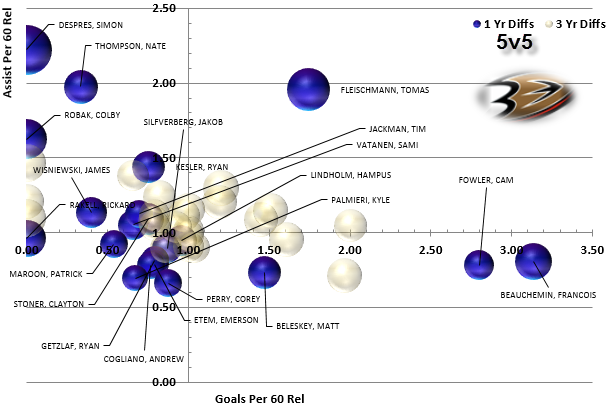
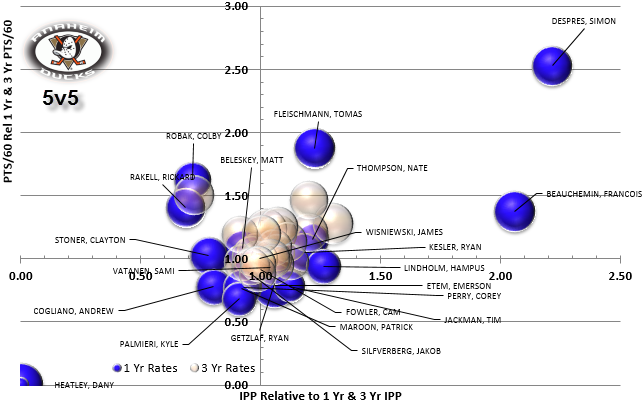
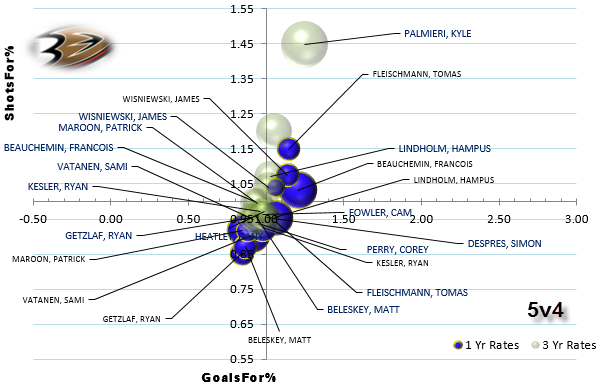
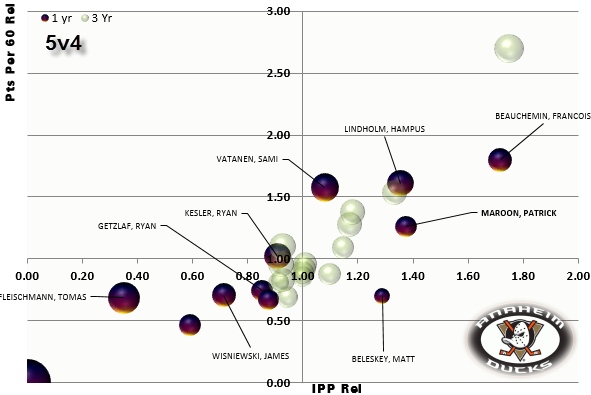
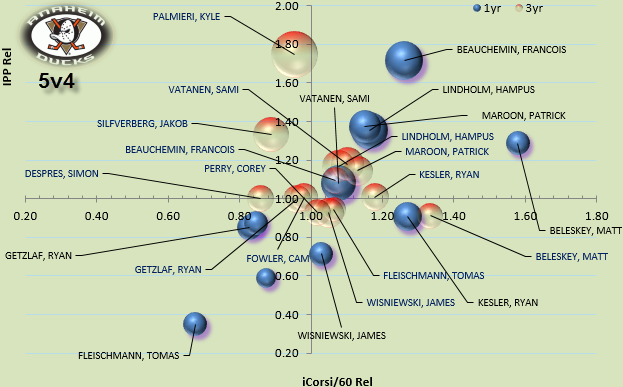
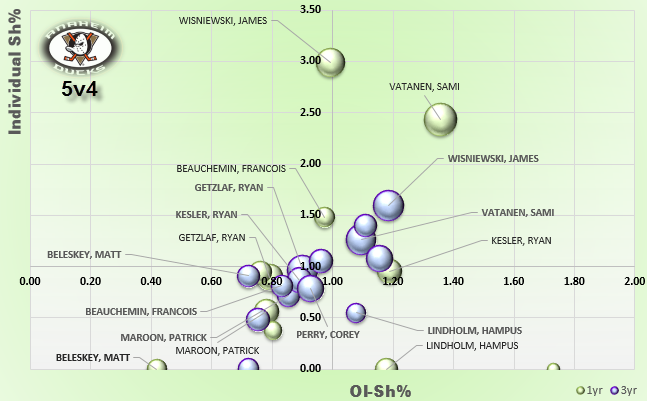
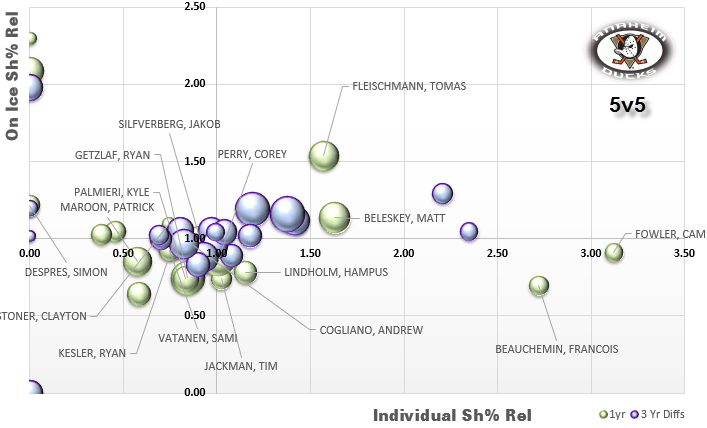
Differential Charts
Differential charts outline last season's production in relation to 1 year ago and a rolling 3 years.
With data from stats.hockeyanalysis.com I divided 2014-15 season into 2013-14 season to produce a differential. Players matching in both seasons production would receive a value = 1 which is also why the charts axes cross there.
Results greater than 1 signify outperforming the 1 year rate.
Results less than 1 means indicate underperforming their 1 year rate.
The 3 year results have a little twist.
There are two values:
-- 3-years ending 2014-15 (seasons of '12-13 thru to '14-15)
-- 3 year rate ending 2013-14 (seasons '11-12 ending '13-14).
The 3 year rate ending last season divided by the 3 year rate entering last season.
This ensures last season's rates don't influence medium term trends essentially isolating '14-15.
Divergent and scattered 1-yr rate differentials seemingly encase 3 year differentials as the latter converge closer to the middle, with players falling into career norms.
I called these relative differentials so on the charts you'll see 'rel'.
Bubble size is Pts/60
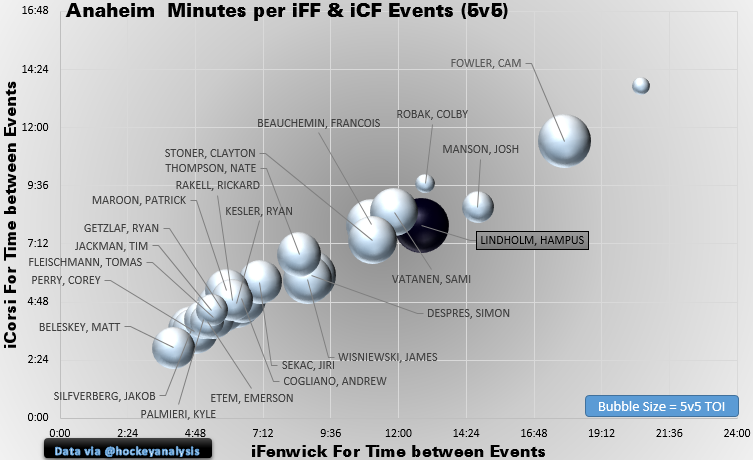
Minute per iCorsi & iFenwick and Miscallaneous
I like looking at time between events for clues. This chart measure the amount of time between each individual shot attempt for each player. Black dot denotes time on ice leader.
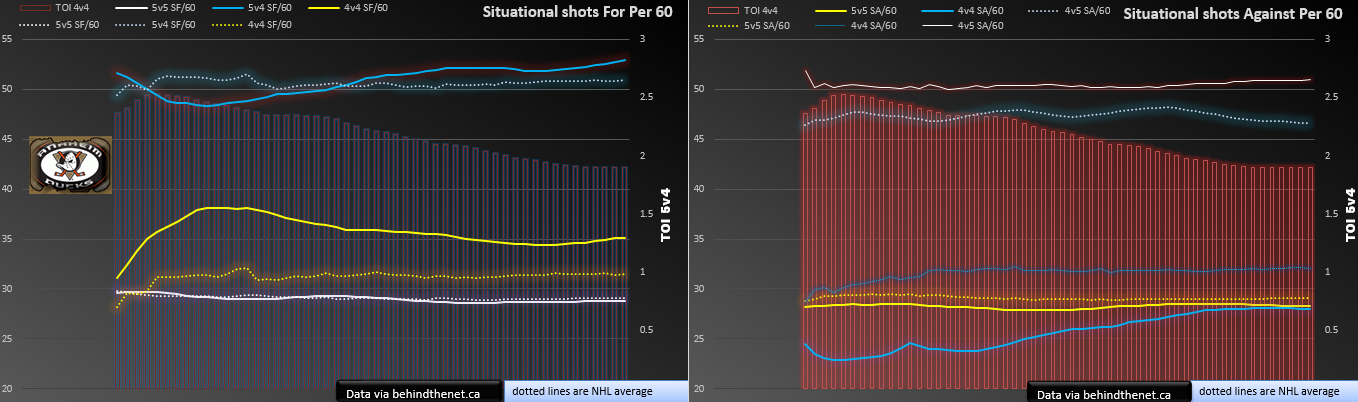
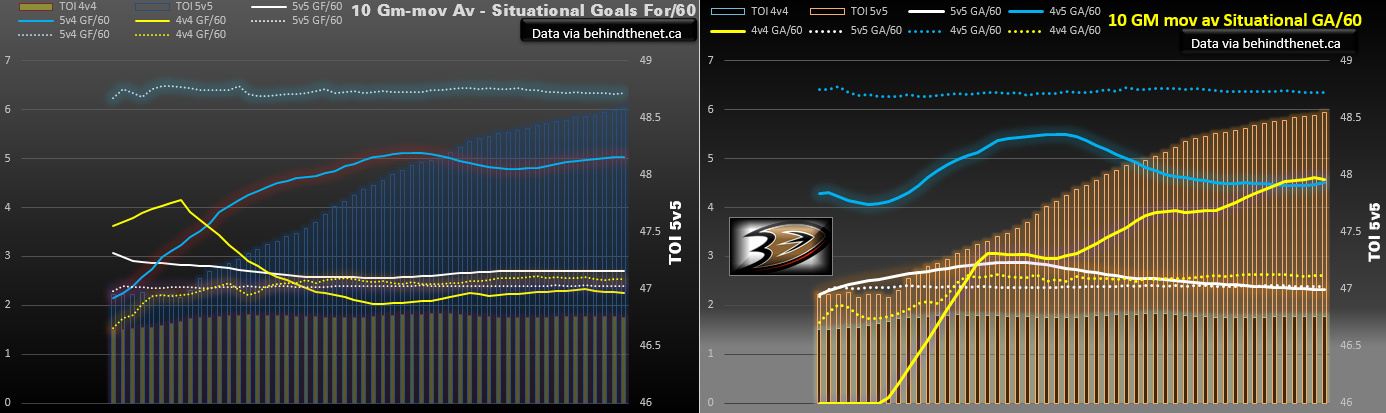
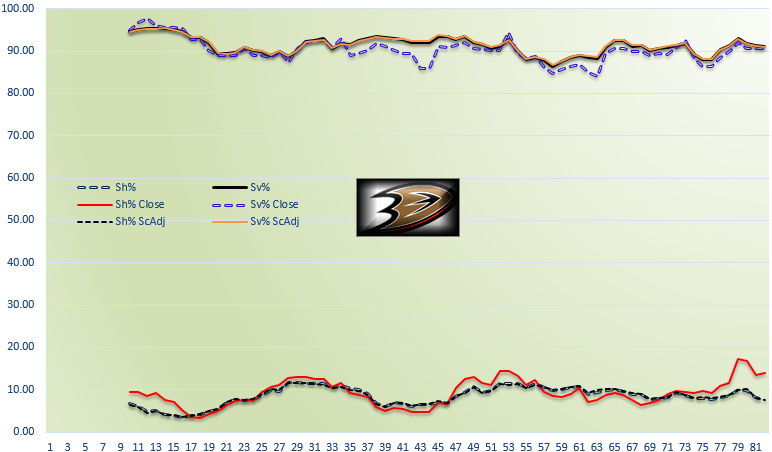
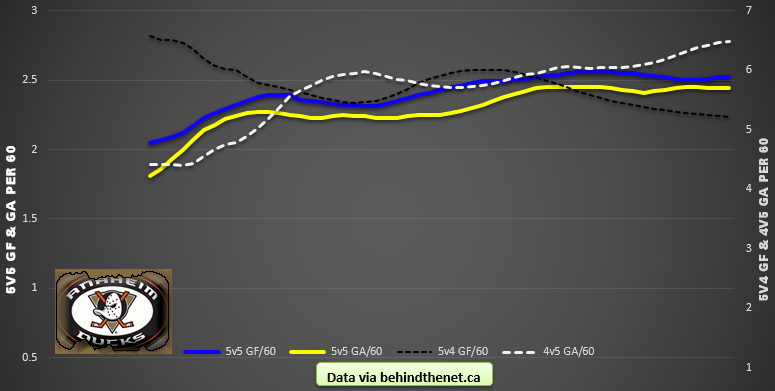
Situational Stats
These are all 10 game moving averages of goals or shots per 60 in various situations as denoted by the legend.
The dotted lines represent the NHL rolling 10-game moving average for comparison purposes.
Click to enlarge the images.