


One could make a case that Bridgeport or Providence possess one of, if not the most difficult schedules in professional sports. Consider this:
- They play 16 sets of three games in three nights. The AHL average is eight (8) per team.
- They’ve played five already, in nine weeks. The AHL average is 2.5 sets per team already played.
- Both went through four straight weekends with a 3-in-3 set.
Despite the scheduling, Providence holds a record of 1-4 in Game 1’s, 0-5 in Game 2’s and 3-2 in Game 3’s. Bridgeport holds a record of 2-3 across all games.
For a full, detailed breakdown team by team, you can download the pdf I created for all AHL teams.
AHL scheduling is bonkers under normal circumstances tacking on travel conditions, sometimes wintery, terrible hikes to the next venue.
Manchester (14) and Springfield (14) are a close second with Texas, Rockford, Milwaukee and Charlotte play the least amount of sets with three each.
This is how the AHL splits in 2014-15. Splits include monthly units for a more micro approach. Manchester and Springfield with four sets in March. Hershey has four in February.
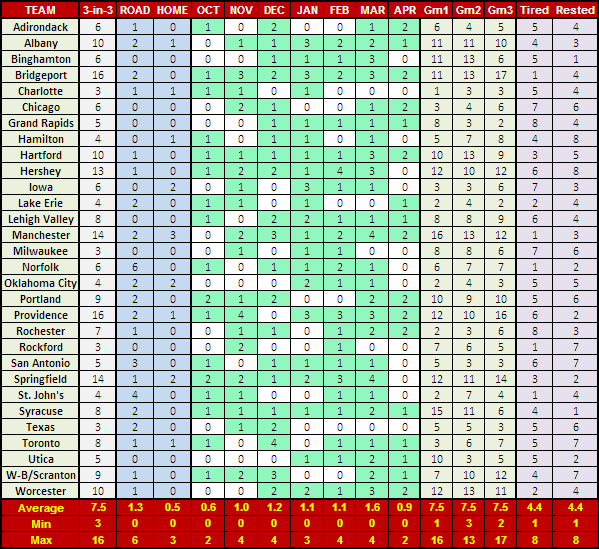
The Gm1, 2 and 3 columns represent the amount of games the listed team has against opposition in the midst a 3-in-3 set. Bridgeport – and Providence – lead the AHL with 17 and 16 games respectively facing a team playing Game 3 of a 3-in-3. The AHL Average is 7.5.
This isn’t new with Providence either. They were one off the most sets in 2013-14 and led the AHL in 2012-13.
I’ve also incorporated the number of games as a rested/tired team on the game in consecutive nights, however, that could mean Game 2 or Game 3 of a set, adding another layer to what should be considered a schedule loss.
In 2014-15 18 games feature a team playing Game 3 versus a rested opponent. Collectively, tired teams have a 2- 7 record.
TEAM RECORDS
To this point, North Division leading Utica Comets and West Division Oklahoma City has yet to play a 3-in-3 set. Presented below are the records for team sets.
The table on the right is the record of teams as the roll through games 1-3 in their sets. That is, Adirondack has an 0-2 record in game 2’s and 2-0 in game 3’s.
The table on the right represents is from the opposition team facing a team in their 3-in-3 set. Albany is 2-1 versus teams playing game 1’s and providence is 5-2 against teams playing game 3’s that is, 5 of 14 wins this season.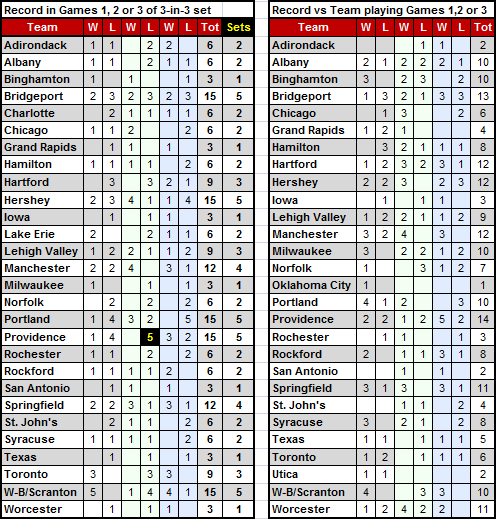
RESTED & TIRED
Of course I couldn’t resist breaking down the rested and tired scenario here. At the NHL level, rested teams usually win about .596% of their games. Thus far in 48 games rested teams have won 32, for a winning percentage of .667%.
Midwest Division leading Rockford IceHogs have played five games as a rested team earning eight points.
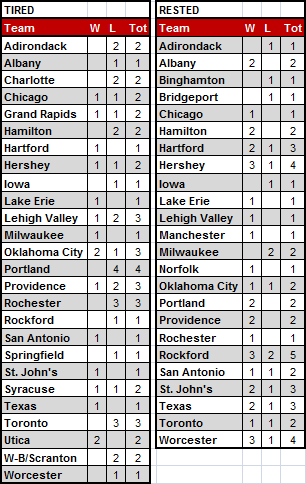
The records are up to mid December. Binghamton, Manchester, Norfolk and Bridgeport, have yet to play as a tired team. On the rested side, Charlotte, Grand Rapids, Springfield, Syracuse, Utica and Wilkes-Barre Scranton have not played as a rested team.
Portland holds the dubious distinction of having four losses as a tired team, both losses to divisional rival, Providence.
I guess there’s a bright light in each schedule after all.
************************
Follow the McKeen's team on Twitter: