


It’s incredible what a few numbers can do to killing any preconceived notion. I thought the NHL was ignoring a vital issue to the proposed realignment plan. It looks like, they may have a handle on it.
Anyone who follows this little corner knows my penchant to analyze schedules. The antennae went up when talk about realignment surfaced on CBC’s Hotstove on Sat February 23.
Elliotte Friedman broke down a proposed set of conferences. Moving Detroit and Columbus into the Eastern Conference seemed to be a major talking point.
Pierre LeBrun in a tweet, indicated a return of the divisional format, instead of two conferences.
According to NHL memo sent to 30 teams, no longer is the idea to go to 4 conferences, but rather 2 conferences with two divisions each
— Pierre LeBrun (@Real_ESPNLeBrun) February 26, 2013
Friedman followed it up with a detailed look at the realignment plan.
A perfectly balanced overall scenario to satisfy every club isn’t remotely possible, but it’s a fair argument for the Red Wings to want to be included in a Conference with the rest of the Northeast Division.
Especially when it comes to back-to-back games.
An example works best here.
This google doc highlights the number of games where the team in the first column has the advantage of playing a team that played a divisional rival the previous night listed across the top.
Using Detroit as an example, they face a team that played Columbus the previous night three times, a division low. Nashville was sloppy second to Detroit the previous night three times and then the Preds toss three teams to the St. Louis Blues the following evening to end the divisional chain.
Columbus, leads the division with six games shown below. Note Chicago benefits with four games and not listed along the top. It’s a nice advantage to have a divisional rival beat up on your next night’s opponent.
| Central | CBJ | DET | NSH | STL |
| Games | 5 | 5 | 6 | 4 |
| CBJ | 1 | 2 | 2 | |
| CHI | 1 | 1 | 2 | |
| DET | 3 | |||
| NSH | 1 | 3 | ||
| STL | 1 | 3 |
Between lockouts, the most games played in this scenario occurred in 2007-08, with a significant drop in the following season that became the trend.
Note*** This is all based out of the following google doc, an aggregate of each season between lockouts.
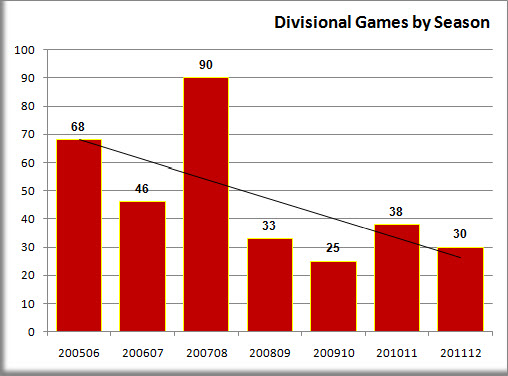
Filtering out all games to isolate only instances of back-to-back games featuring divisional rivals exclusively, the breakdown is below. The trend is decreasing significantly after a high of 90 games in 2007-08.
Coincidentally, the drop by almost two thirds of the games between 2007-08 and 2008-09 coincides with the release of Dirk Hoag’s NHL Super Schedule – the source of inspiration for my focus on rested versus tired teams on back to back nights.
Detroit can make a case for wanting to leave the Central division, aside from travel and time zone differences. In 2012-13 shortened season the Central leads every division with 20 instances as per the table above, while the aggregate for the Northeast is an NHL low.
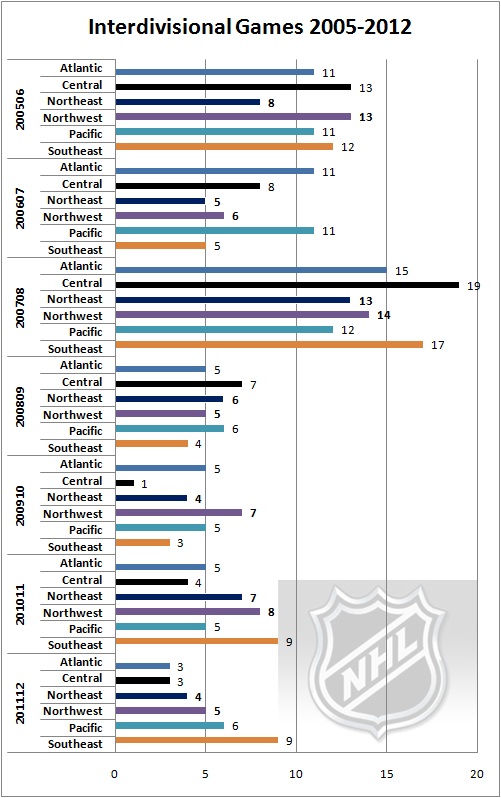
Further filtering to only divisional clubs exclusively reveals the differences between the Central and the Northeast division leading up to ’07-8, but the trend seems to be reversing in the following seasons. The Central had eight instances since ’07-8 and the Northeast 15.
The Southeast division is the most affected in the past two seasons. The change from Atlanta to Winnipeg may have affected that in ’11-12 but that doesn’t explain ’10-11. Teams traveling through Florida, playing a combination of the Panthers one night, then the Lightning the following night or the opposite inflate these numbers. It’s no surprise the Pacific and Northwest follow this pattern, especially with so much air travel involved.
| Season | Atlantic | Central | Northeast | Northwest | Pacific | Southeast | Grand |
| 200506 | 11 | 13 | 8 | 13 | 11 | 12 | 68 |
| 200607 | 11 | 8 | 5 | 6 | 11 | 5 | 46 |
| 200708 | 15 | 19 | 13 | 14 | 12 | 17 | 90 |
| 200809 | 5 | 7 | 6 | 5 | 6 | 4 | 33 |
| 200910 | 5 | 1 | 4 | 7 | 5 | 3 | 25 |
| 201011 | 5 | 4 | 7 | 8 | 5 | 9 | 38 |
| 201112 | 3 | 3 | 4 | 5 | 6 | 9 | 30 |
| TOTALS | 55 | 55 | 47 | 58 | 56 | 59 | 330 |
This is what it looks like in a graph form, with the distinct drop in games between ’07-8 and present day.
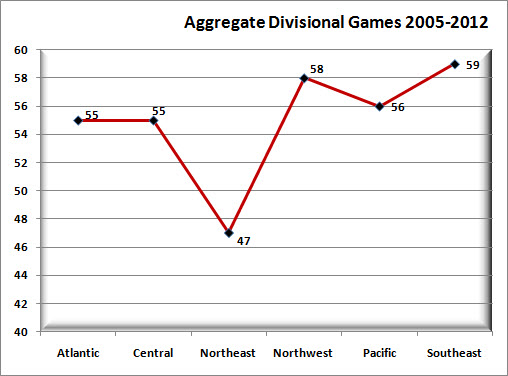
The graph below is a visual representation of the aggregate of games featuring a divisional club facing off two games back to back against two different division rivals. Note the effects in the corners of the NHL divisions, Northwest, Pacific and Southeast. This drop in the Central division from a high of 19 games in ’07-8 falls into this as teams are more spaced out, yet in the Atlantic, it’s a stable low.
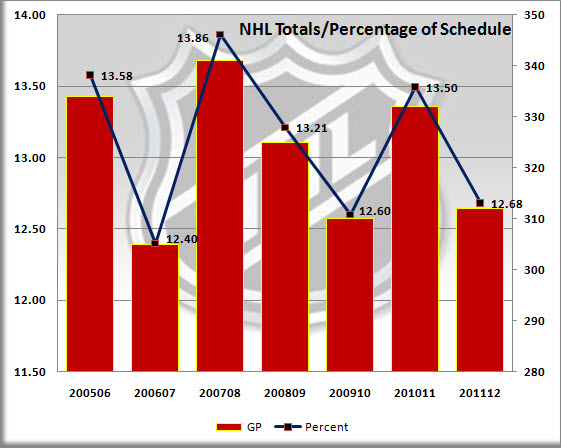
Stepping back to look at the overall NHL totals reveals the impact.
The graph below doesn’t filter out divisional rivals, including all teams that contributed to these back to backs. For instance, the above tables and graphs focused strictly within the division, for example, Calgary, playing Edmonton and then flying to Vancouver the following night.
The differentiation between divisional rivals is not filtered out below, so, as an example, Philadelphia playing through Anaheim and then Los Angeles the following day. The impact is the same, offering Anaheim the disadvantage of not playing a tired team and the advantage for the Los Angeles in the following evening. The Bars in the chart represent the amount of games scaled on the right. The Line represents the percentage of the NHL schedule those games represented.
This is where it gets tricky, as I am not in any way the Good Will Hunting math-y type. If Pythagoras was a distant relative, he would be truly embarrassed based on his expectation.
I decided to see if there was any trend in the standard deviation season over season for both instances of divisional games versus an overall NHL-wide scenario. These are graphed below. The Bars represent the amount of games affected by each season.
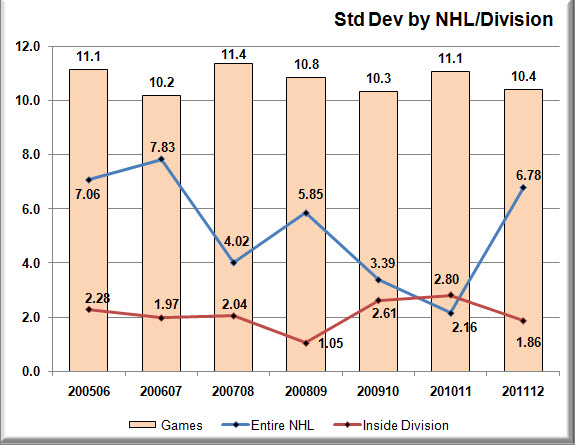
The trend between divisional games is fairly stable, lingering somewhere between a 2008-09 low of 1.05 games, to a high of 2.8 in 2010-11.
Where the NHL may have been more aware and did a better job in evening out the disparity is in reducing the amount of games teams outside the division play that affect inter-divisional rivals. The numbers almost insinuate an attempt to try to even out the disparity in ’07-8 by bringing every team to around the same level of games before reducing the overall amount of games the following season at the sacrifice of a slight uptick in standard deviation.
The anomaly of 2011-12 is due to the puzzlingly low amount of games in the Atlantic division (39) versus an average of 54.6 in other divisions. Removing the Atlantic division reveals a standard deviation of 2.68, which is an increase from the 2.16 in 2010-11.
EFFECTS
I multiplied the percentage of games affected per season by 82.. Between 10 to11 games every season are affected on average each season, which is fairly significant with a potential 20 points on the line, not taking into consideration any three-point games and downstream effects.
Considering the cutoff for non-shortened seasons is slightly over 90 points, 10 games is a significant amount, enough to be the difference between a playoff spot and a tee time.
Realignment is inevitable. If there’s one component teams may want to try to address it’s this back to back situation. There is no way to evenly balance schedules league-wide, but perhaps with the look at the past seasons within lockout bookends the NHL has been able to bring the disparity into proportion across the board as a secondary benefit.
Follow the McKeen's team on Twitter:
@KatsHockey
@mckeenshockey