


American Thanksgiving marked the unofficial end of the first quarter of the NHL season and time for some retrospection of some teams. Traditionally, I’d turn to typical Corsi and Fenwick along with derivative stats, but I've been enthusiastic by these newer score-adjusted metrics quickly establishing their value into the analytics discussion thus far around the quarter mark of the NHL season.
The original work by Eric Tulsky using the original data via behindthenet.ca has seen tweaks and enhancements to even suggestions that ‘close’ metrics may not necessarily be as predictive or originally though.
Steve Burtch expanded on this concept based off work by Micah Blake McCurdy and I’m intrigued to see where this is going. The nature seems to be to discard the limitations associated with ‘close’ parameters and supplement that with score, venue and schedule adjusted data.
There are even resources already doing the calculations for you, like Puck on Net, while and Puckalytics and original sister site Hockey Analysis already houses the raw data.
I like how the distinction here is between game-states, however, for the purposes of this writing, I’m not looking at the predictive value, only a snapshot of teams in different game states and keying in on some shorter team trends.
I like the fact we can break down specific game situations by time and events, when teams are tied, up or down by a goal, then by two or more goals. Let’s begin.
GAME TIED
Teams end up the majority of time with the game tied. There are outliers like the Pittsburgh Penguins who score first early and skew the time on ice by spending the majority of their time up a goal or two. The near past also shows a jump in the metrics based on time on ice with a deficit.
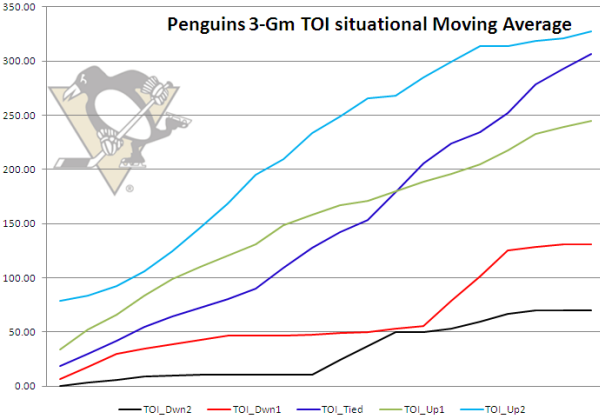
Minnesota, Carolina and Columbus also share this affinity, however that cluster of teams at the top of the chart, the bottom feeders of the NHL and the … Calgary Flames?
The chart (using data by Puck on Net) illustrates raw Corsi For and Corsi Against while the game is tied while bubble size represents time on ice. Teams in the lower left quadrant are playing less when the game is tied and more traveling along the x-axis. The cluster at the top is interesting due to the inclusion of the pesky Flames with that group. In short, while playing most of the game tied, the Flames along with the cluster of bottom feeding teams are allowing more Corsi Against events than Corsi For.
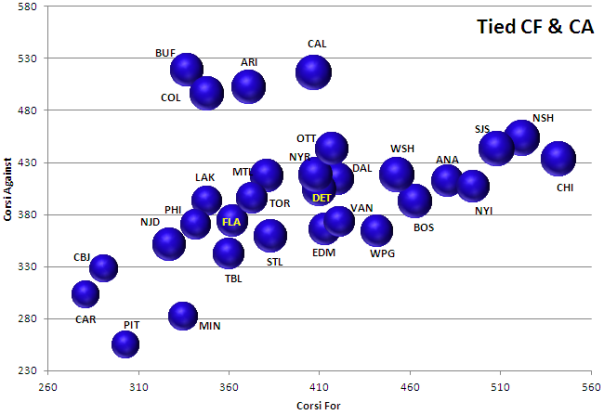
Time on ice is fairly consistent, the bubbles being very similar in size, albeit the ones in the lower left quadrant seem to be a bit smaller, mirrored by the low number of overall events. We will expand on the Hurricanes and Wild below.
GAME DOWN BY A GOAL
Here I’m more concerned with teams playing in traditional close situations and their individual components.
When the game starts to get away and teams start to lead by two or more goals, score effects kick in and we see teams with the lead press on a little less and teams playing without the lead apply more shooting pressure. Score effects are well documented and don’t need any expansion here.
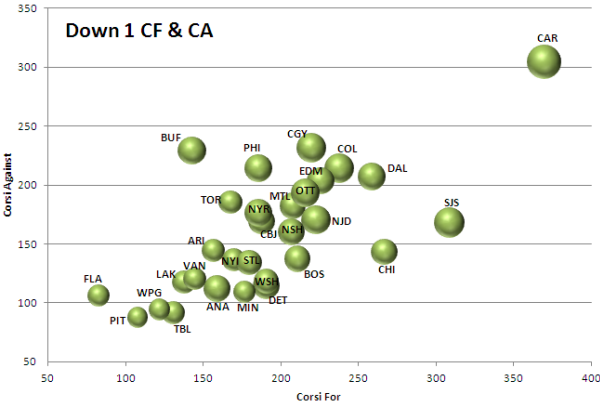
The graph plots individual Corsi For events along the x-axis and the Corsi Against along the y-axis.
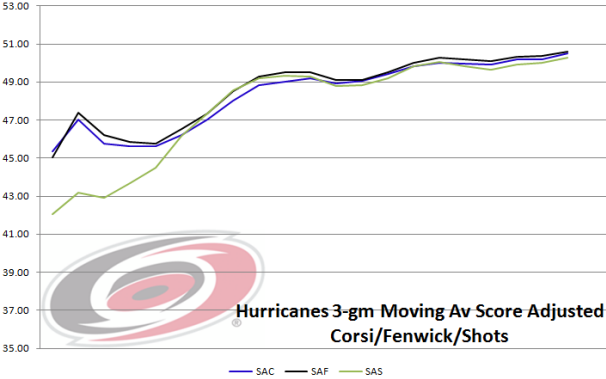
Most teams are clumped together in a range with outliers here are the Carolina Hurricanes and even the San Jose Sharks (while also playing at a high proportion of game tied minutes) with almost double the For events than Against. The Canes spend the majority of their game time down one goal and the cumulative effect over the season timeline has recently surpassed their time on ice while the game is tied (team charts are a rolling 3-game moving average).
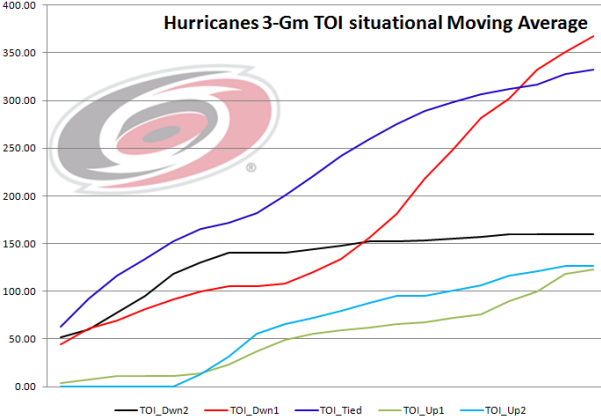
The uptick with the team up by a goal and up by two goals, eerily corresponds to the return of team leader, Eric Staal from injury and even though the Hurricanes spend an inordinate amount of time playing from behind, the black line indicating being down by two or more goals has flatlined. Even with the Canes time on ice down by a goal their score-adjusted shot metrics are creeping up to over 50%.
The San Jose Sharks started off fairly hot, but signs over the near term are trending negative. Travis Yost, the analytics writer over at TSN does a good job expanding on the Sharks off season transactions after the disastrous playoff exit and just how well Joe Thornton has performed for the scrutiny he’s faced seemingly his entire career in the Bay Area.
This is how the Sharks situational season looks.
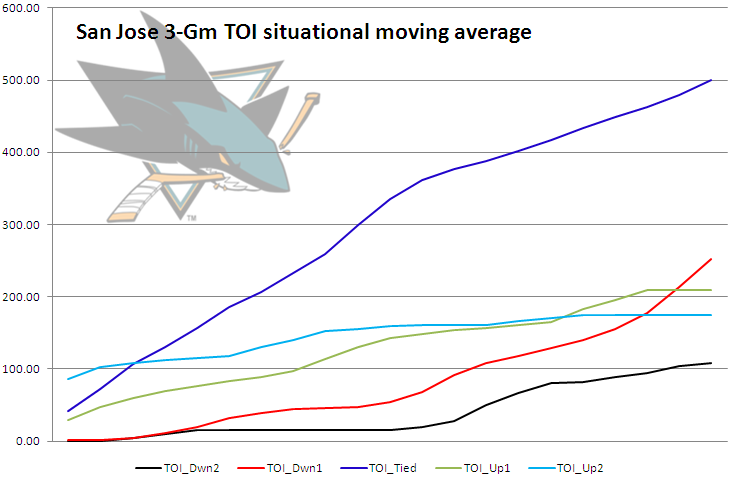
We can see early on how they played more with a wide lead and then (scoring 3.8 goals per game) and sputtered (down to 2.7 goals per game) – while even losing to Buffalo 2-1 at home. At the quarter point, the down one goal line begins to trend up – sharply, coinciding with a rise in time down two or more goals. Both metrics indicating playing with the lead are a lot flatter than a winning team desires.
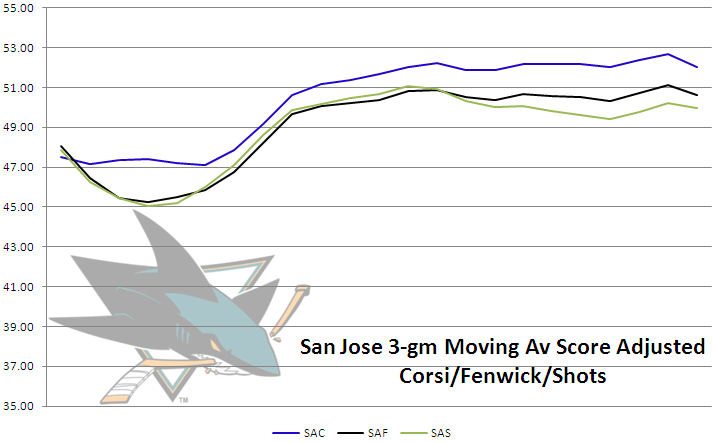
A 3-game moving average of score adjusted Corsi, Fenwick and even shots, are all trending down after swooping upswing earlier on in the season. Something to watch for the California based club.
GAME UP BY A GOAL
Let's look at now at the game state of being up by a goal. There’s a little more separation here from the chart down one goal, with two main clusters.
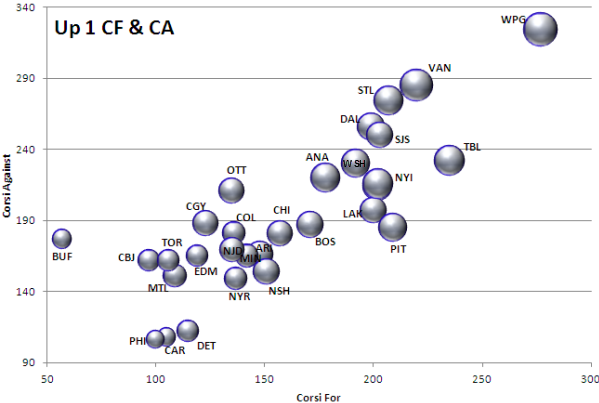
It's no surprise Buffalo with a very small bubble is also shown your with very few Corsi For events, just over 50, and having almost four times the same amount of Corsi Against events. In fact, bubble size expands the further the bubble appears from the y-axis, with Winnipeg looking like Jupiter sized bubble compared to the Mars and Mercury-like size of the bubbles in the lower left quadrant.
Not pictured here, since these values are as of the American Thanksgiving, is the November 28 Buffalo game against Montreal featured the Sabres with a one goal lead for 30 minutes. Heading into the contest, having amassed an unassuming 118 minutes up one goal, the 30 minute increase represented an increase their time by almost 25% of the season total.
The real outlier here is the Winnipeg Jets, tracing the knife’s edge between winning and losing while only really being up a goal for the majority of their playing time (other than a tie game). Their situational season timeline is in the chart below.
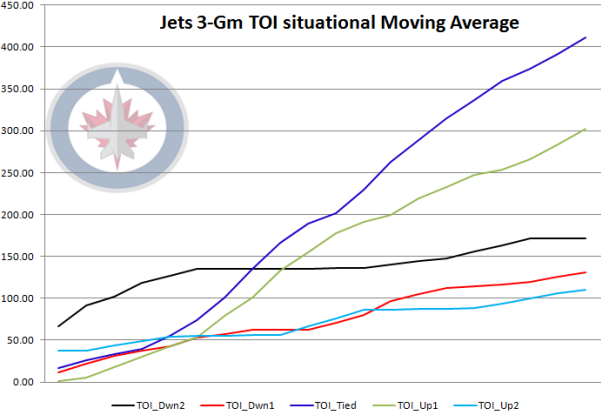
The Jets were going down by more than two goals very early in the season and then between the fifth and 10th game something began to limit their defense affecting their down by two or more goals line to plateau, with a corresponding ascension in both game tied and up one goal situations.
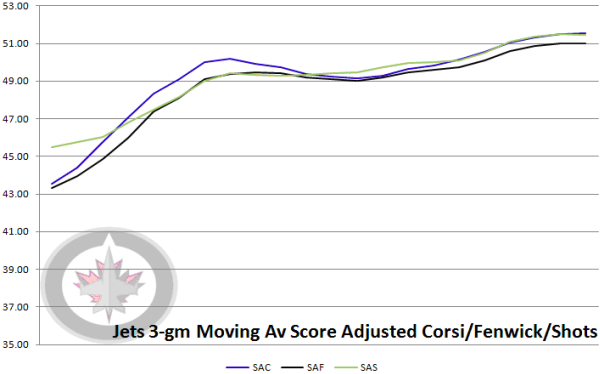
Winnipeg started the season with a 1-4 record - scoring at a rate of 1.8 goals per game and allowing three - only to win six of their next eight games, allowing 11 goals (1.375 per game) and scoring only two per game – a very thin margin. They rallied along to a .500 record and a mark of (5-4-3) record in the last dozen games. To maintain any semblance of success the run after the break away from the pattern of being stuck in the zone between game tied in plus-1 situations. Their individual score-adjusted Corsi, Fenwick and Shots 3-game rolling average has seen the increase from the beginning of the season to peak just over 51% overall for all three metrics.
Let's move on to our final team, the Minnesota Wild. A hot start has become a staple for the Wild, only to tail off and struggle for a playoff spot.
Not so in 2014-15 where they started off with consecutive shutouts against last year’s surprising Colorado Avalanche. The Wild sustained some immediate success finding some scoring touch early on (averaging 3.4 goals in the first 10 games and only 2.3 since then up to American Thanksgiving) exemplified by their up two goals line in the chart below.
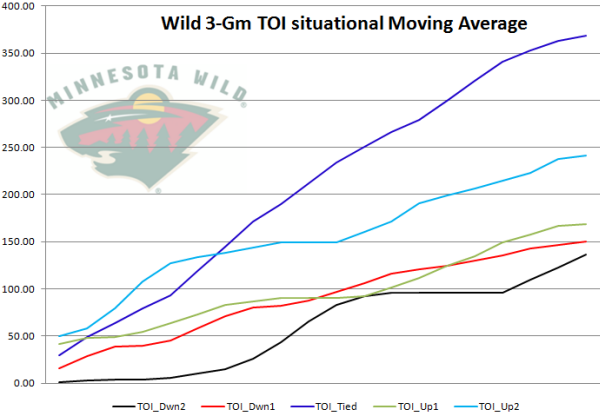
There’s a hiccup during a four game stand that saw them score only three goals, while allowing 14, indicated by the flat segment of the up two goals line and sharp upturn in the down two goals line. In the near past, that down two goals line has once again taken an immediate sharp upturn as the Wild defense hasn’t shown the same stinginess it did in the early part of the season.
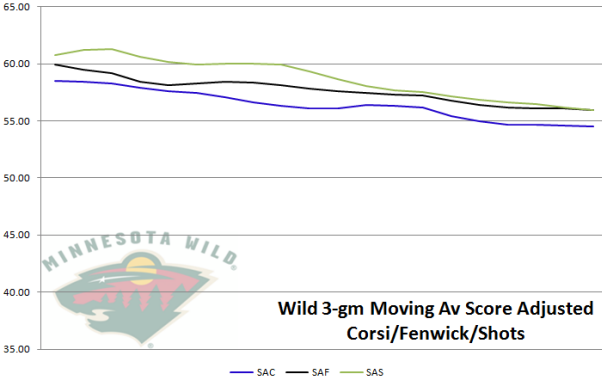
When taking the individual Score-Adjusted Corsi, Fenwick and Shots moving average, the trend is negative from an unsustainable 60% clip early in the campaign. Even at this 55% clip, there is still some room for a negative correction with the result being a loss of standings points. It’s a good bet to keep a watch on the Wild.
************************
Follow the McKeen's team on Twitter: