


It’s been written that a picture is worth 1000 words.
If that’s true, then this is going to be a 30,000 word blog post .. if there ever was one. This is actually going to be around 30,500, but hey, who’s counting.
Before presenting the following, a little explanation is in order.
The hockey world (fuelled by bloggers and math nerdlingers) is breaking new ground with the ability to analyze players and using technology to better capture the nuances missed in game to game situations.
Websites like Gabe Desjardins Behind the Net and David Johnson Hockey Analysis have become valuable resources to decipher the numbers and put meaning to the way player’s performance is analyzed.
Two of the measures act as a proxy for a team’s possession of the puck, providing estimates of player’s time with the puck. A good primer for advanced stats is here (and I will delve more into using analytics in this space here on McKeen’s)
Corsi (a stat named after Buffalo Sabres goaltending coach Jim Corsi) is a ratio measuring shots on goal, blocked shots and missed shots fired at the opposition net, over the same criteria fired upon the players own net. JP at Japers Rink has a good introduction to the statistic and Broad Street Hockey advances the discussion with a comprehensive look at Advanced stats over a series of posts.
The logic dictates that the team that has greater possession of the puck will likely be firing upon the opposition’s goal rather than a player’s own goal is a signal to indicate that team has puck possession.
Fenwick is a similar measure, however it removes the blocked shots, while still providing a ratio of shots on goal and missed shots. The measure is defined here from Raw Charge – a Tampa Bay Lightning blog on SB Nation:
Fenwick: Measure of shots for and missed shots for as a percentage of all shots taken. Used more for teams than players. Often divided into game situation : Score-tied, 1-up, 1-down, 2-up, 2-down, 3-up, 3-down. This is because teams that are behind tend to shoot more than teams that are ahead, and the further behind they are the more pronounced this "score effect" is. It's so pronounced after falling 3 behind that everything goes out the window and there's no real point in separating it out any further.
Fenwick is also occasionally divided by period, as shooting tendencies change the further into a game one gets.
Fenwick measures tend to be more predictive of win-loss records for a season than Corsi measures, but Corsi is better for short-term analysis of puck possession, as it includes more events and so accounts for outliers (randomness) better. Just remember Fenwick = teams, long-term; Corsi = players and teams, shorter-term.
*********
These measures are more indicative of trends and apply for better use over greater sample sizes, but I was curious to see the game-to-game effects of both Corsi and Fenwick measures.
To do that, I was able to get all the game data from timeonice.com measuring each game’s corsi and fenwick events broken down by each individual components. An example is here, using the Leafs and Sabres game from March 21, 2013
After compiling all the data for each individual game, I was able to put together a game-by-game look at the differences of each measure, by team and then by player.
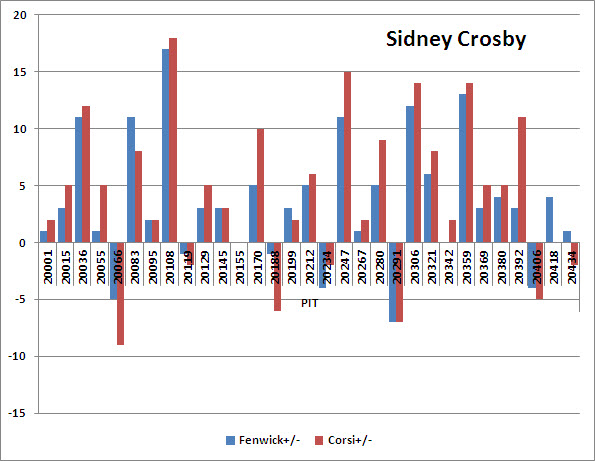
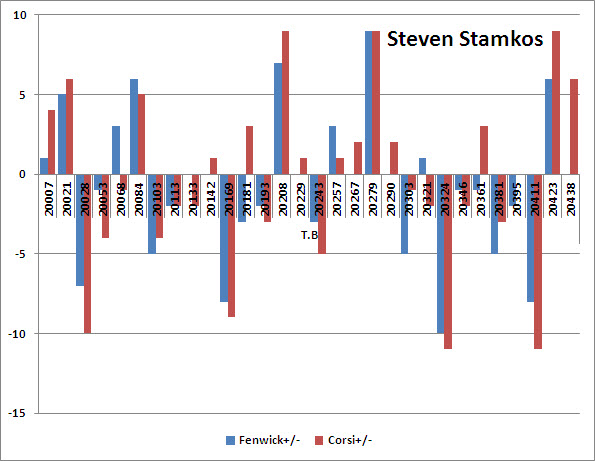
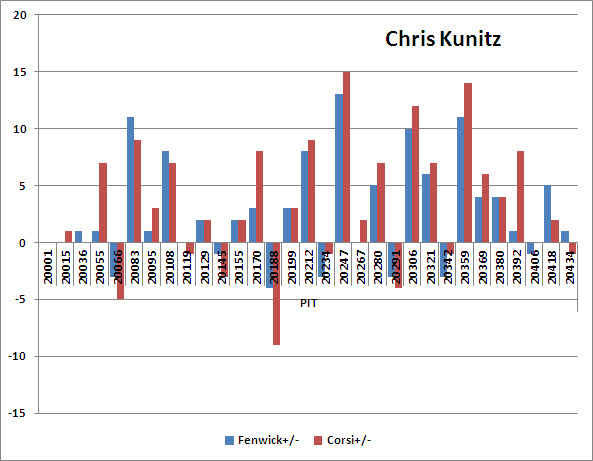
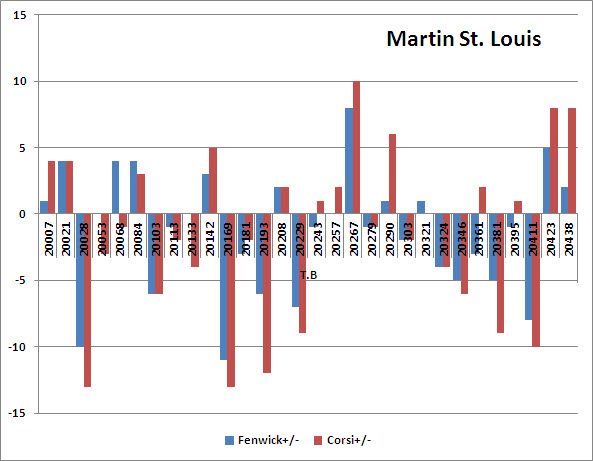
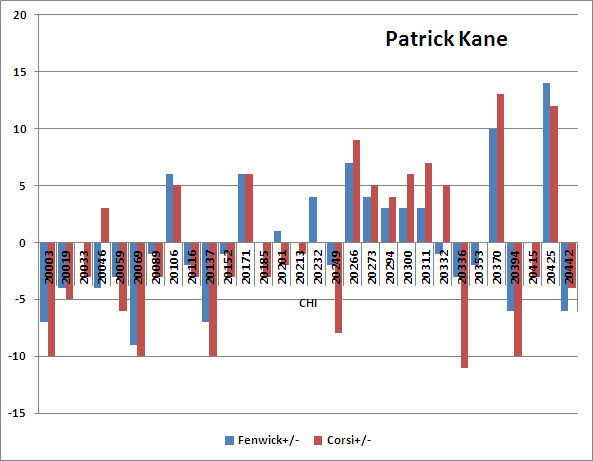
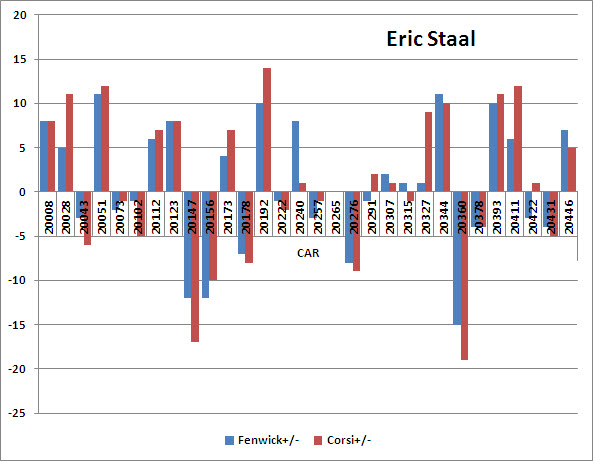
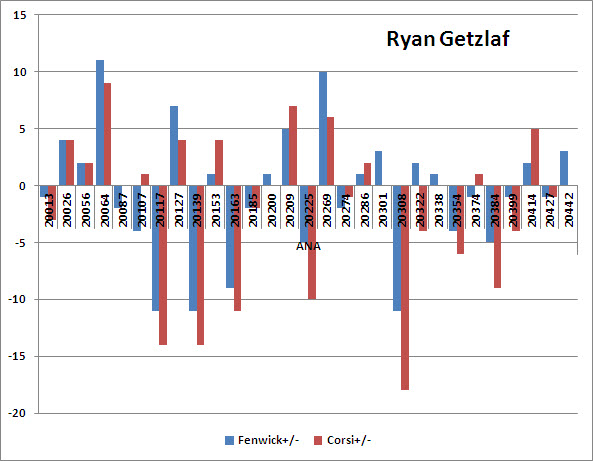
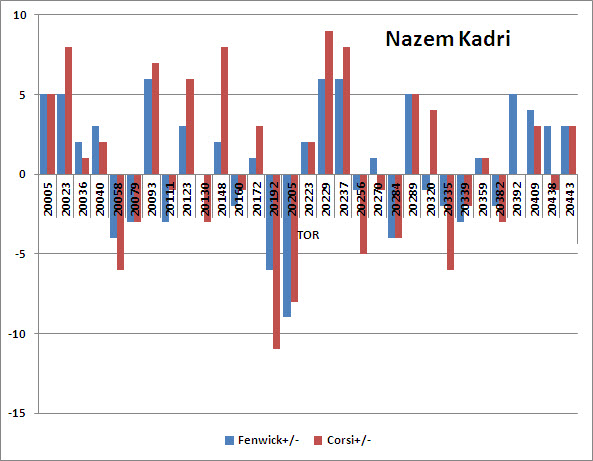
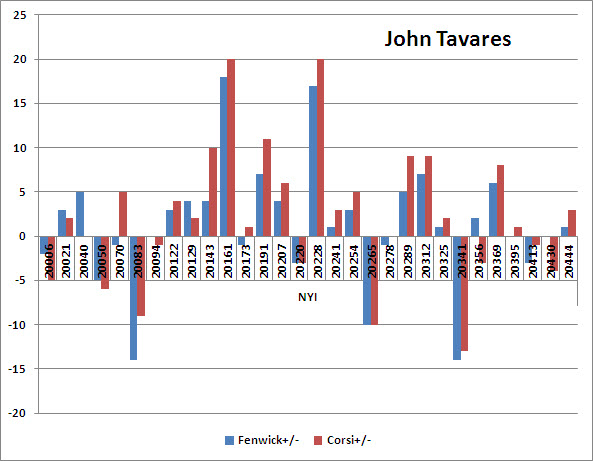
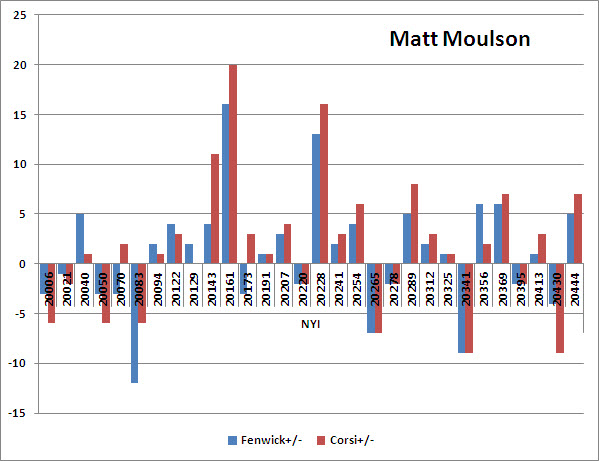
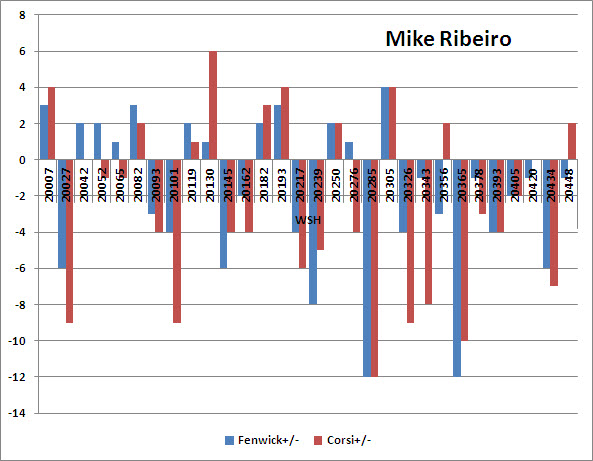
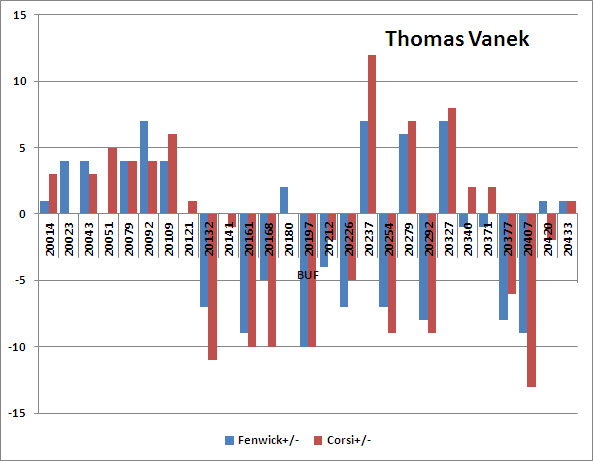
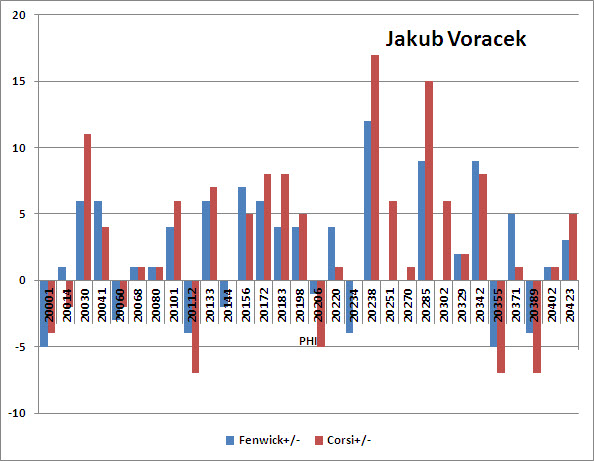
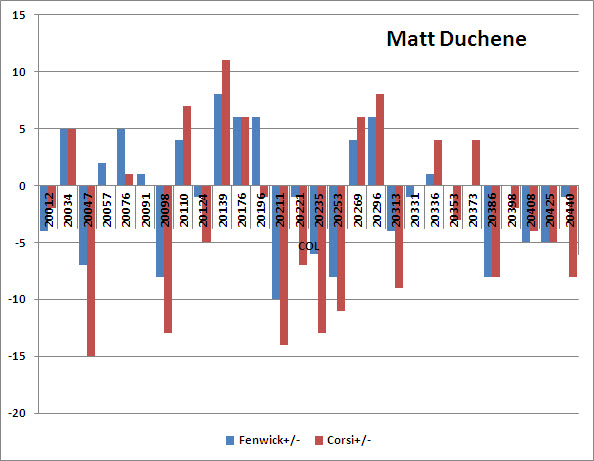
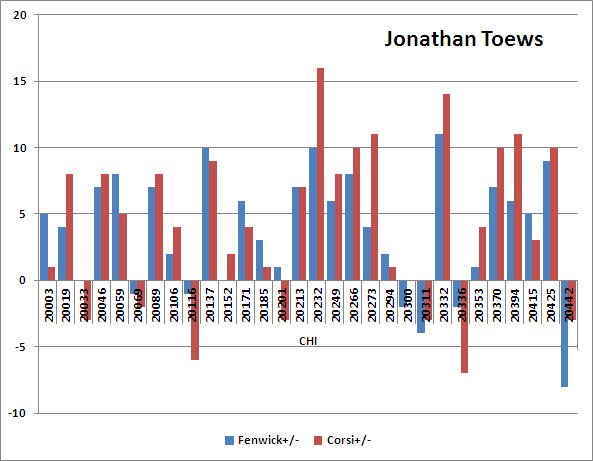
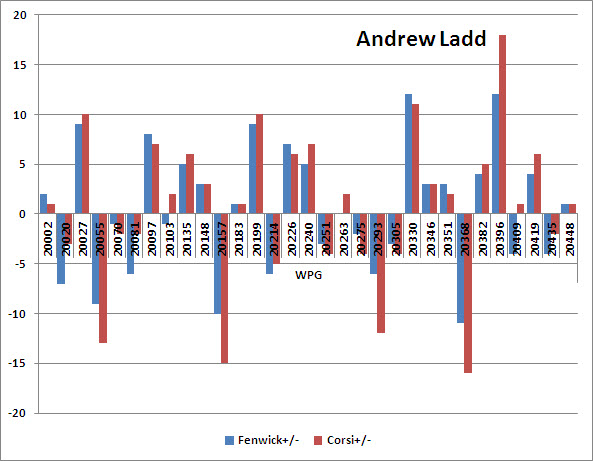
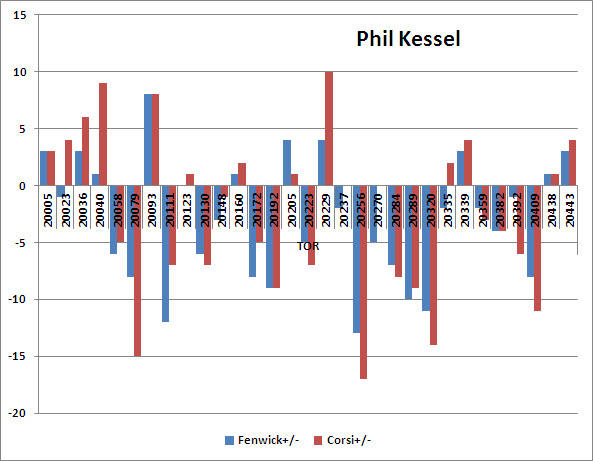
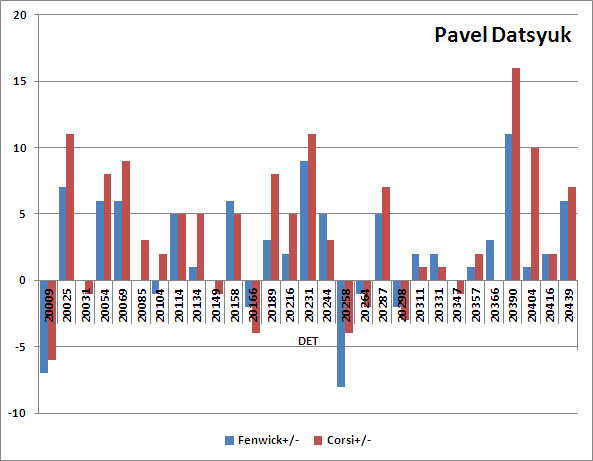
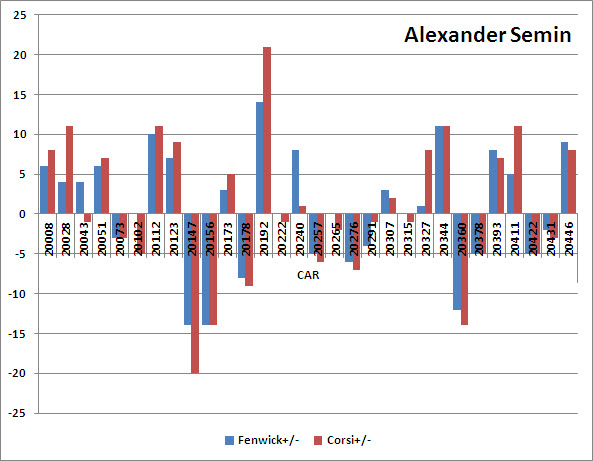
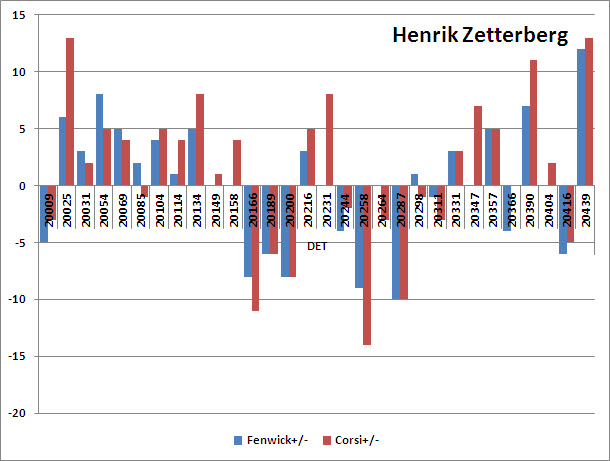
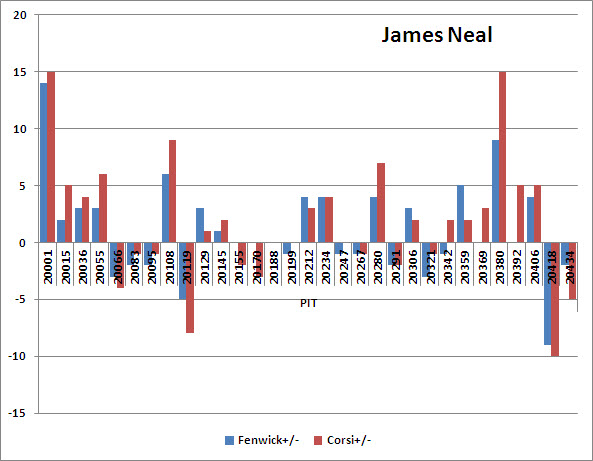
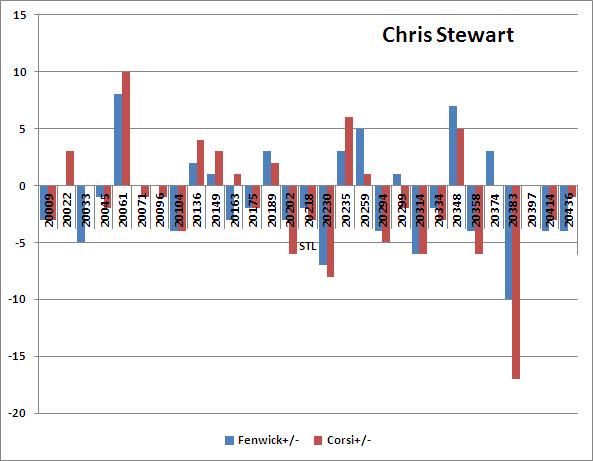
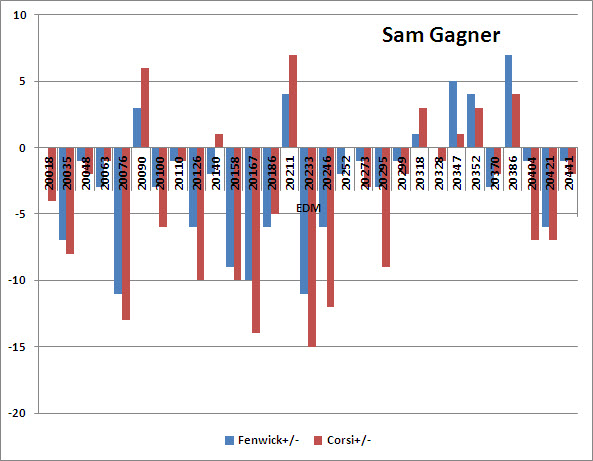
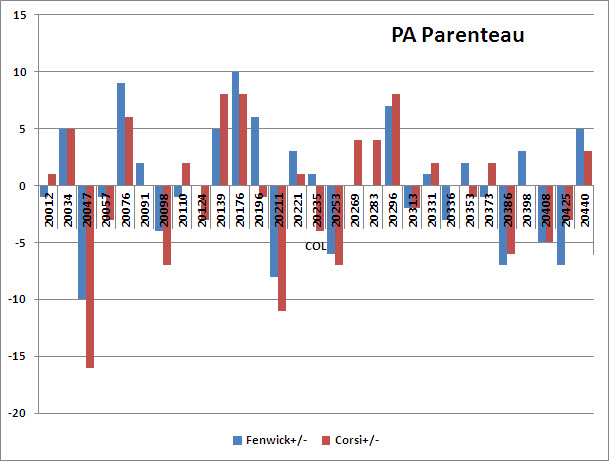
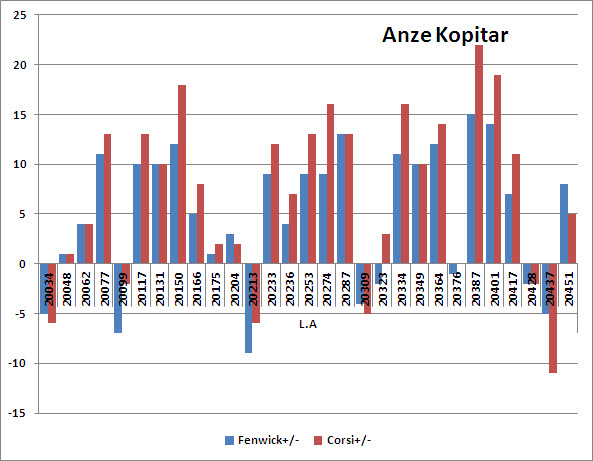
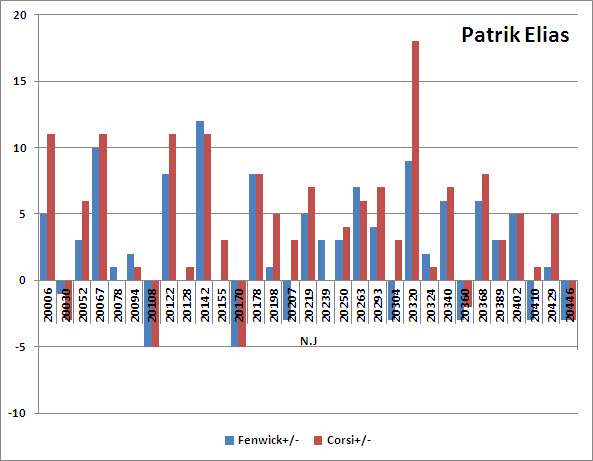
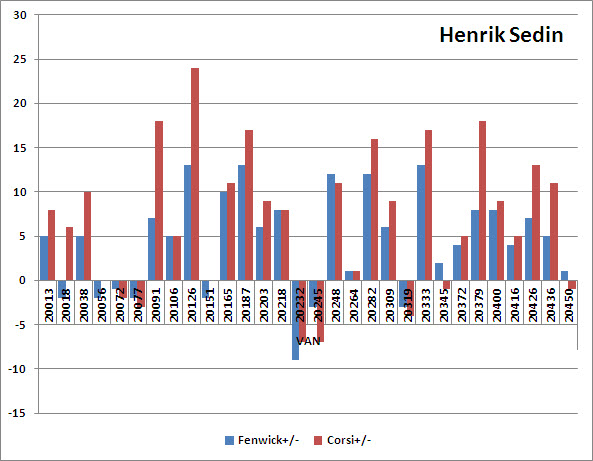
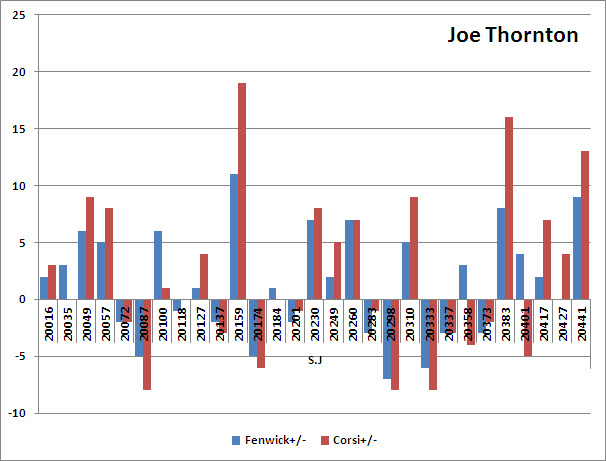
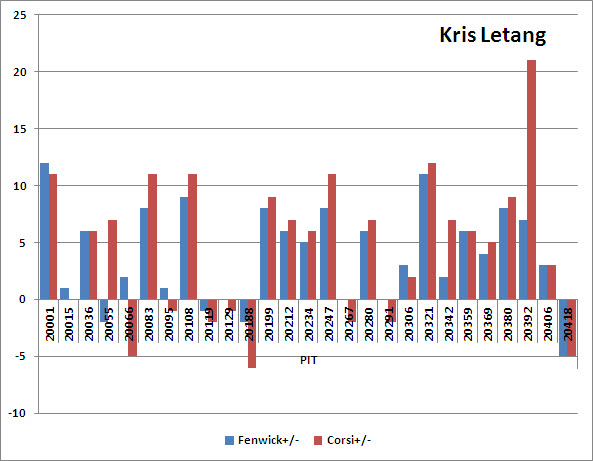
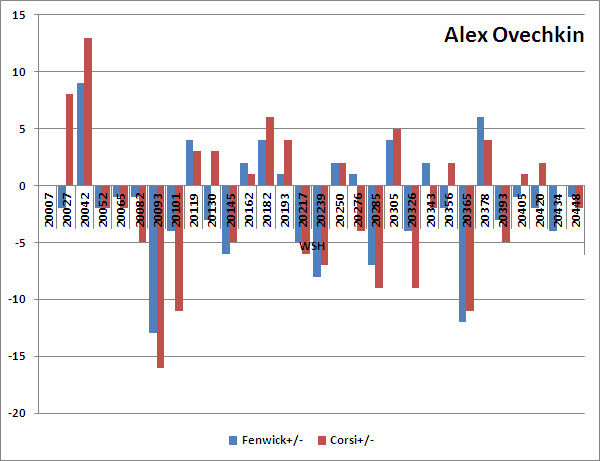
This is where the 30,000 words come into play. The following is a visual representation of the top-30 scorers in the NHL (as of Mar 22, 2013) based on their individual Corsi and Fenwick measures on a game-to-game basis. Note the numbers across the horizontal axis are the game numbers assigned by the NHL.
Follow the McKeen's team on Twitter:
@KatsHockey
@mckeenshockey